Code
x = sp.symbols('x', real=True)
y = sp.Function('y')(x)In the chapter on differential equations, we explored linear ordinary differential equations (ODEs). While linear ODEs can often be solved analytically, e.g., with sympy.dsolve, nonlinear ODEs typically require numerical methods. This chapter focuses on time integration methods designed for nonlinear differential equations.
Differential equations model changes in some quantity and are typically expressed together with what is initially known as initial values (IV). Thus, the initial value problem (IVP) we will consider is of the form:
\[ (\mathrm{IVP}) \begin{cases}y^{\prime}(x)=f(x, y) & (\mathrm{ODE}) \\ y\left(x_0\right)=y_0 & (\mathrm{IV})\end{cases} \tag{7.7.1}\]
or as a system:
\[ (\mathrm{IVP})\left\{\begin{array}{rlr} y^{\prime}(x) & =f(x, y, v), & y\left(x_0\right)=y_0 \\ v^{\prime}(x) & =f(x, y, v), & v\left(x_0\right)=v_0 \\ & \vdots \end{array}\right. \tag{7.7.2}\]
These are solved in parallel with the methods described below for the scalar IVP in 7.7.1.
Example 7.7.1
x = sp.symbols('x', real=True)
y = sp.Function('y')(x)DE = sp.Eq(y.diff(x, 1), y)
IV = {y.subs(x, 0): 1}
sp.dsolve(DE, ics=IV)\(\displaystyle y{\left(x \right)} = e^{x}\)
In this chapter, we study various numerical methods for solving the initial value problem (7.7.1). Our goal is to find approximate values of the solution \(y(x)\) at discrete points \(x_0, x_1, x_2, \ldots\) without needing an analytical formula.
To build intuition, we start with a concrete example before developing the general theory.
Consider the differential equation \[ \dfrac{d y}{d x} = y, \quad y(0) = 1 \]
We know from Example 7.7.1 that the exact solution is \(y(x) = e^x\). But suppose we did not know this. How could we approximate the solution numerically?
The idea is simple: use the definition of the derivative. Since \(\dfrac{dy}{dx} \approx \dfrac{y(x + h) - y(x)}{h}\) for small step size \(h\), we can rearrange to get
\[ y(x+h) \approx y(x)+\dfrac{dy}{dx}h \]
Since the differential equation tells us that \(\frac{dy}{dx}=y\), we can write an update scheme:
\[ y_{i+1} = y_i + y_i h \tag{7.7.3}\]
Starting from the initial condition \(y_0 = 1\) at \(x_0 = 0\), we step forward with \(h=0.1\):
h = 0.1 # step size
x_vals = np.arange(0, 1 + h, h) # x values from 0 to 1
y_0 = 1 # initial condition y(0) = 1
y_vals = [y_0] # list to store y values
for i, x_i in enumerate(x_vals[:-1]): # exclude last x value
y_new = y_vals[-1] + h * y_vals[-1] # Update scheme
y_vals.append(y_new) # Append new y value to the list
x_new = x_vals[i + 1] # The x value where y_new is computed
print(f"Step {i+1}: x = {x_i:.1f}, y = {y_vals[-2]:.6f} -> x = {x_new:.1f}, y_new = {y_new:.6f}")Step 1: x = 0.0, y = 1.000000 -> x = 0.1, y_new = 1.100000
Step 2: x = 0.1, y = 1.100000 -> x = 0.2, y_new = 1.210000
Step 3: x = 0.2, y = 1.210000 -> x = 0.3, y_new = 1.331000
Step 4: x = 0.3, y = 1.331000 -> x = 0.4, y_new = 1.464100
Step 5: x = 0.4, y = 1.464100 -> x = 0.5, y_new = 1.610510
Step 6: x = 0.5, y = 1.610510 -> x = 0.6, y_new = 1.771561
Step 7: x = 0.6, y = 1.771561 -> x = 0.7, y_new = 1.948717
Step 8: x = 0.7, y = 1.948717 -> x = 0.8, y_new = 2.143589
Step 9: x = 0.8, y = 2.143589 -> x = 0.9, y_new = 2.357948
Step 10: x = 0.9, y = 2.357948 -> x = 1.0, y_new = 2.593742fig, ax = plt.subplots(figsize=(6, 4))
y_exact = sp.dsolve(DE, ics=IV).rhs
mk.fplot(y_exact, (x, 0, 1),
label='Exact Solution',
color='red',lw=2)
ax.plot(x_vals, y_vals, 'o-b',
label='Euler Approximation',
markersize=4)
ax.set(xlabel='$x$', ylabel='$y$')
ax.legend()
plt.show()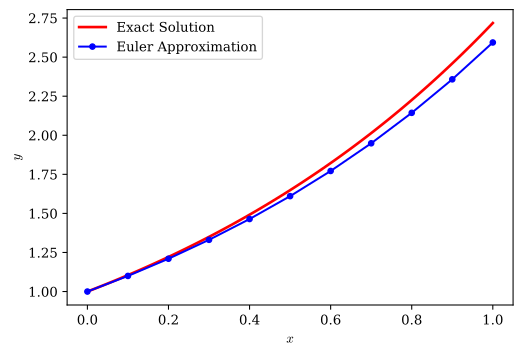
The numerical approximation tracks the exact solution reasonably well, though we observe a growing error. This raises several important questions. Will the method always produce a solution, and is the computed solution the correct one? How does the error depend on the step size \(h\), and when can we trust numerical methods to work? To answer these questions, we need some mathematical theory.
Theorem 7.7.1 If \(f(x, y)\) is continuous, then a solution to \(y^{\prime}(x)=f(x, y)\) exists. (Augustin Louis Cauchy, Giuseppe Peano)
Continuity guarantees existence, but it does not guarantee uniqueness. Multiple solution curves might pass through the same initial point, making the problem ill-posed for numerical methods.
Theorem 7.7.2 Let \(f(x, y)\) be continuous for all points \((x, y): a \leq x \leq b,-\infty \leq y \leq \infty\), where \(a, b\) are finite. If \(f\) satisfies a Lipschitz condition (Rudolf Lipschitz)
\[ \left|f(x, y_1)-f\left(x, y_2\right)\right| \leq L\left|y_1-y_2\right| \tag{7.7.4}\]
for \(a \leq x \leq b\) and all \(y_1, y_2\), then there exists a unique solution to (7.7.1) for every initial value \(y\left(x_0\right)=y_0, x_0 \in[a, b]\). The constant \(L\) is called the Lipschitz constant.
The inequality (7.7.4) compares what happens when we evaluate \(f\) at two different \(y\) values while keeping \(x\) fixed. The subscripts 1 and 2 simply mean “two different values we’re comparing.”
The Lipschitz condition says: pick any two different values \(y_1\) and \(y_2\). When we plug them into \(f(x, y_1)\) and \(f(x, y_2)\) (at the same \(x\)), the difference in outputs cannot be more than \(L\) times the difference in inputs.
This means the function \(f\) cannot change too abruptly when we vary \(y\) while keeping \(x\) fixed. The constant \(L\) bounds how sensitive \(f\) is to changes in \(y\). The smaller \(L\), the more “well-behaved” the function.
Example 7.7.2 For our introductory example \(y' = y\), we have \(f(x,y) = y\). Let’s check the Lipschitz condition. Pick any two values, say \(y_1 = 3\) and \(y_2 = 5\):
\[ |f(x,3) - f(x,5)| = |3 - 5| = 2 = 1 \cdot |3-5| \]
The difference between outputs is \(|3-5| = 2\), which equals exactly 1 times the difference between inputs, also 2. Try any other pair and you’ll always get the same factor of 1. This shows that for \(f(x,y) = y\), the Lipschitz constant is \(L = 1\).
More generally, for any \(y_1\) and \(y_2\): \[ |f(x,y_1) - f(x,y_2)| = |y_1 - y_2| = 1 \cdot |y_1 - y_2| \]
This tells us the problem is well-posed: the solution exists and is unique.
This matters in engineering. Consider a mechanical system whose state evolves according to a differential equation. If small changes in the current state lead to wildly different future behavior (large \(L\) or no Lipschitz bound at all), the system is sensitive to measurement errors and numerical approximations. Conversely, when the Lipschitz constant is finite and moderate, small errors in our numerical approximation stay controlled as we step forward in time.
The Lipschitz condition also guarantees uniqueness of solutions. This is essential: if multiple solution curves could pass through our initial condition, which one should a numerical method follow? Uniqueness removes this ambiguity.
For most engineering problems, we can find the Lipschitz constant using calculus. If the partial derivative \(\frac{\partial f}{\partial y}\) exists and is bounded in our domain of interest, then its maximum value serves as a Lipschitz constant. This follows directly from the mean value theorem.
Let’s see this with a different example:
Example 7.7.3 Consider the differential equation
\[ y^{\prime}(x)= x y \]
with initial condition \(y(0)=1\) on the interval \(x \in[0,1]\). Here, \(f(x, y) = xy\). We compute the partial derivative
\[ \frac{\partial f}{\partial y} = x \]
On the interval \([0,1]\), this derivative varies between 0 and 1, so its maximum is 1. We can verify this directly: for any two values \(y_1\) and \(y_2\),
\[ \left|xy_1 - xy_2\right|=|x|\left|y_1-y_2\right| \leq 1 \cdot \left|y_1-y_2\right| \]
since \(|x| \leq 1\) on our domain. Thus, the Lipschitz constant is \(L=1\).
For systems of differential equations expressed in matrix form, we can compute the Lipschitz constant using matrix norms.
Theorem 7.7.3 For the linear system \(\mathbf{y}^{\prime}=\mathbf{A} \mathbf{y}\) where \(\mathbf{A}\) is a constant matrix, the Lipschitz constant equals the matrix norm
\[L=\|\mathbf{A}\|_{\infty}=\max _i \sum_j\left|a_{i j}\right|\]
This is the maximum absolute row sum: add the absolute values of entries in each row, then take the maximum across all rows. This norm is easy to compute.
For more details on these theorems and proofs, refer to e.g., [1] and [2].
We now connect these theoretical results to the practical task of computing numerical solutions. The Lipschitz constant \(L\) controls how errors behave as we step through our numerical approximation. When we take a step of size \(h\), any error we introduce gets multiplied by approximately \(1 + Lh\) as we move forward. Over many steps, errors can accumulate, but the Lipschitz constant bounds this accumulation.
Returning to our introductory example with \(y' = y\), we found \(L = 1\). With step size \(h = 0.1\), errors grow by a factor of roughly \(1 + 1 \cdot 0.1 = 1.1\) per step. Over 10 steps from \(x=0\) to \(x=1\), the cumulative error factor is approximately \((1.1)^{10} \approx 2.59\). This explains why we see visible deviation from the exact solution in the figure above, even though the method tracks the general trend correctly.
This has immediate practical consequences. If \(L\) is small, we can take larger steps \(h\) without errors growing uncontrollably. If \(L\) is large, we must use smaller steps to maintain accuracy. Advanced numerical methods use estimates of \(L\) to automatically adjust the step size, taking large steps when the solution is smooth and small steps when it changes rapidly.
The Lipschitz condition also enables convergence proofs. We can show that as the step size \(h \to 0\), numerical methods like the one used in Section 28.1.2 converge to the true solution. The convergence rate depends on both the method’s order and the Lipschitz constant. This is why Lipschitz continuity appears throughout the theory of numerical differential equations: it provides the mathematical foundation for trusting that our numerical approximations actually approach the correct answer. See e.g., [3], [chap. 2.2] for more details.
The theorems above provide mathematical guarantees that solutions exist, are unique, and that numerical methods converge as the step size \(h \to 0\). These results are essential, but in practice we also need a direct, computational way to build confidence in our numerical approximations. The standard approach is called verification: we apply the numerical method to a problem whose exact solution is known and compare the two.
This is precisely what we did in Figure 7.7.1. The differential equation \(y' = y\) with \(y(0) = 1\) has the known exact solution \(y(x) = e^x\), which allowed us to plot both the numerical approximation and the analytical solution on the same axes. The close agreement between the two curves is direct evidence that the numerical method is working correctly. Had we made an error in the update formula or the implementation, the comparison would have revealed it immediately.
This idea generalizes into a systematic methodology known as verification and validation (V&V) in computational science and engineering. Verification asks “are we solving the equations correctly?” while validation asks “are we solving the right equations?” Verification is a mathematical question answered by comparing numerical results against analytical solutions, checking convergence rates, and testing conservation properties. Validation is a physical question answered by comparing model predictions against experimental measurements. Both are necessary, but verification must come first: there is no point comparing a simulation to an experiment if we cannot even solve the underlying equations correctly.
Throughout this chapter, we will repeatedly use verification as our primary tool for assessing numerical methods. Whenever we introduce a new method, we will test it on problems with known solutions to confirm that the implementation is correct and to measure how accuracy depends on the step size. When exact solutions are unavailable, we can still verify by refining the step size and checking that the numerical solution converges, or by confirming that the method preserves known physical invariants such as energy or momentum. These computational experiments complement the theoretical error bounds derived from the Lipschitz analysis and together provide a solid foundation for trusting numerical solutions in engineering practice.
Having explored the basic idea through our introductory example, we now formalize Euler’s method for general initial value problems.
For the general initial value problem \[ y'(x) = f(x, y), \quad y(x_0) = y_0 \] Euler’s method constructs a sequence of approximations \(y_0, y_1, y_2, \ldots\) at points \(x_0, x_1, x_2, \ldots\) separated by step size \(h\). The update formula is
\[ \boxed{ y_{i+1} = y_i + h f(x_i, y_i) } \tag{7.7.5}\]
This generalizes equation (7.7.3) from our introductory example, where \(f(x,y) = y\).
At the initial point \(\left(x_0, y_0\right)\) we obtain a tangent direction \(y^{\prime}=f\left(x_0, y_0\right)\) from the differential equation. If we step \(h\) in \(x\) with this direction, we arrive at the point \(\left(x_1, y_1\right)\), where \(x_1=x_0+h\) and \(y_1=y_0+h f\left(x_0, y_0\right)\). We then approximate \(y_1 \approx y\left(x_1\right)\).
We determine a new tangent direction \(y^{\prime}=f\left(x_1, y_1\right)\) at this new point, continue the step \(h\) in \(x\) with this updated direction to reach \(\left(x_2, y_2\right)\), where \(x_2=x_1+h=x_0+2h\) and \(y_2=y_1+h f\left(x_1, y_1\right)\). We hope that \(y_2 \approx y\left(x_2\right)\), and so on.
from matplotlib.animation import FuncAnimation
# Recompute the Euler approximation for animation
h = 0.1
x_vals = np.arange(0, 1 + h, h)
y_vals = [1.0] # Initial condition
for i in range(len(x_vals) - 1):
y_new = y_vals[-1] + h * y_vals[-1]
y_vals.append(y_new)
# Exact solution
x_exact = np.linspace(0, 1, 100)
y_exact_vals = np.exp(x_exact)
# Create animation
fig, ax = plt.subplots(figsize=(8, 5), dpi=150)
def animate(frame):
ax.clear()
# IVP info box at top center
ivp_text = (
r"$\frac{dy}{dx} = y, \quad y(0) = 1$"
)
ax.text(0.5, 0.98, ivp_text,
transform=ax.transAxes,
fontsize=11,
verticalalignment='top',
horizontalalignment='center',
bbox=dict(boxstyle='round', facecolor='lightblue', alpha=0.8))
# Plot exact solution
ax.plot(x_exact, y_exact_vals, 'r-', lw=2, label='Exact Solution')
# Plot Euler approximation up to current frame
if frame > 0:
ax.plot(x_vals[:frame+1], y_vals[:frame+1], 'o-b',
lw=2, markersize=4, label='Euler Approximation')
else:
ax.plot(x_vals[0], y_vals[0], 'ob', markersize=4, label='Euler Approximation')
# Show tangent direction for current step
if frame < len(x_vals) - 1:
x_curr = x_vals[frame]
y_curr = y_vals[frame]
# Tangent line segment: from current point with slope f(x,y) = y
slope = y_curr # Since dy/dx = y
x_tangent = [x_curr, x_curr + h]
y_tangent = [y_curr, y_curr + h * slope]
ax.plot(x_tangent, y_tangent, 'g--', lw=1.5, alpha=0.7, label='Tangent Direction')
ax.plot(x_curr, y_curr, 'go', markersize=6) # Current point
# Next point
ax.plot(x_vals[frame+1], y_vals[frame+1], 'gs', markersize=6)
# Info text box in lower right
y_next = y_vals[frame+1]
f_val = y_curr # f(x,y) = y
info_text = (
f"$f(x,y) = y$\n"
f"$y_{{{frame+1}}} = y_{{{frame}}} + h f(x_{{{frame}}}, y_{{{frame}}})$\n"
f"${y_next:.4f} = {y_curr:.4f} + {h:.1f} \\cdot {f_val:.4f}$"
)
ax.text(0.98, 0.02, info_text,
transform=ax.transAxes,
fontsize=10,
verticalalignment='bottom',
horizontalalignment='right',
bbox=dict(boxstyle='round', facecolor='wheat', alpha=0.8))
ax.set_xlabel('$x$')
ax.set_ylabel('$y$')
ax.set_title(f"Euler's Method: Step {frame}/{len(x_vals)-1}")
ax.legend(loc='upper left')
ax.set_xlim(-0.05, 1.05)
ax.set_ylim(0, 3)
ax.grid(True, alpha=0.3)
anim = FuncAnimation(fig, animate, frames=len(x_vals), interval=800, repeat=True)
plt.close()
mk.to_responsive_html(anim, container_id='euler-animation')The method is based on the Taylor expansion, truncated after the first derivative. At point \(x_i\) we replace \(y^{\prime}\left(x_i\right)\) with a forward difference, whereby the differential equation transforms into
\[ \frac{y\left(x_{i+1}\right)-y\left(x_i\right)}{h} \approx y^{\prime}\left(x_i\right)=f\left(x_i, y_i\right) \]
Rearranging gives equation (7.7.5). The method follows the tangent line at each step, which explains why errors accumulate: we repeatedly approximate a curve by straight line segments.
Consider the pendulum example from the chapter on differential equations. The second-order ODE \[ \frac{d^{2} \theta}{d t^{2}}+\frac{g}{L} \sin \theta=0 \]
Our second order ODE can be rewritten as a system of first-order ODEs by introducing an intermediate variable as the first derivative of \(\theta\):
\[ \omega = \frac{d\theta}{dt} \]
this has a physical meaning: it is the angular velocity of the pendulum. Now we can write the initial second-order ODE as the system:
\[ \begin{cases} \dfrac{d \omega}{d t} = -\dfrac{g}{L} \sin \theta \\[1.5em] \dfrac{d \theta}{d t} = \omega \end{cases} \]
In general, any higher-order ODE can be converted into a system of first-order ODEs by introducing new variables for each derivative up to one order less than the original equation.
For a second-order ODE involving \(\frac{d^2y}{dt^2}\), we typically let: \[ y_1 = y \quad \text{(the original function)} \]
\[ y_2 = \frac{dy}{dt} \quad \text{(the first derivative)} \]
Then we get: \[ \frac{dy_1}{dt} = y_2 \]
And our original second-order equation becomes an equation for \(\frac{dy_2}{dt}\).
Example: Suppose we have
\[\frac{d^2y}{dt^2} + 3\frac{dy}{dt} + 2y = 0\]
With \(y_1 = y\) and \(y_2 = \frac{dy}{dt}\), this becomes the system:
\[ \begin{cases} \dfrac{dy_1}{dt} = y_2 \\[1.5em] \dfrac{dy_2}{dt} = -3y_2 - 2y_1 \end{cases} \]
General pattern: For an \(n\) th-order ODE, introduce \(n\) variables: \(y_1 = y\), \(y_2 = y'\), \(y_3 = y''\), …, \(y_n = y^{(n-1)}\). This gives \(n\) first-order equations, where the first \(n-1\) are just \(\dfrac{dy_k}{dt} = y_{k+1}\), and the last one comes from the original equation solved for the highest derivative.
See 7.7.12 for more details.
We tackle the solution by approximating both \(\theta\) and \(\omega\) at discrete time steps using Euler’s method, starting from the highest derivative, i.e., \(\omega\) and working our way down to \(\theta\).
\[ \begin{cases} \dfrac{d \omega}{d t} \approx \dfrac{\omega_{i+1}-\omega_i}{h} = -\dfrac{g}{L} \sin \theta_i \\[1.5em] \dfrac{d \theta}{d t} \approx \dfrac{\theta_{i+1}-\theta_i}{h} = \omega_i \end{cases} \tag{7.7.6}\]
Leading to the update formulas: \[\begin{cases} \omega_{i+1} = \omega_i - h \dfrac{g}{L} \sin \theta_i \\[1.5em] \theta_{i+1} = \theta_i + h \omega_i \end{cases}\]
We have two choices in (7.7.6): use the current value \(\omega_i\) to update \(\theta\), or use the newly computed value \(\omega_{i+1}\). The latter approach leads to a different numerical method called the semi-implicit Euler method or Euler-Cromer method, which has better stability properties for certain problems.
\[ \boxed{\begin{cases} \dfrac{d \omega}{d t} \approx \dfrac{\omega_{i+1}-\omega_i}{h} = -\dfrac{g}{L} \sin \theta_i \\[1.5em] \dfrac{d \theta}{d t} \approx \dfrac{\theta_{i+1}-\theta_i}{h} = \omega_{i+1} \end{cases} } \]
leading to the (stable) Euler-Cromer update formulas: \[ \boxed{ \begin{cases} \omega_{i+1} = \omega_i - h \dfrac{g}{L} \sin \theta_i \\[1.5em] \theta_{i+1} = \theta_i + h \omega_{i+1} \end{cases} } \]
See this video for a demonstration of the difference between Euler and Euler-Cromer methods for orbital simulation. The video gives a great introduction to the importance of numerical stability in simulations and introduces the concept of phase-space conservation.
from matplotlib.animation import FuncAnimation
# Pendulum parameters
g = 9.81 # gravitational acceleration (m/s^2)
L = 1.0 # length of pendulum (m)
# Initial conditions: start horizontally
theta_0 = np.pi / 2 # 90 degrees
omega_0 = 0.0 # initially at rest
# Time parameters
h = 0.01 # time step (s)
T_approx = 2 * np.pi * np.sqrt(L / g) * 1.2 # Approximate period (with factor for large amplitude)
t_max = 2* T_approx # Simulate one period
t_vals = np.arange(0, t_max, h)
# Euler-Cromer method
theta_vals = [theta_0]
omega_vals = [omega_0]
for i in range(len(t_vals) - 1):
omega_new = omega_vals[-1] - h * (g / L) * np.sin(theta_vals[-1])
theta_new = theta_vals[-1] + h * omega_new # Use updated omega
omega_vals.append(omega_new)
theta_vals.append(theta_new)
# Create animation with two subplots side by side
fig, (ax1, ax2) = plt.subplots(1, 2, figsize=(12, 5), dpi=100)
def animate(frame):
ax1.clear()
ax2.clear()
# Left plot: Pendulum visualization in xy coordinates
theta_curr = theta_vals[frame]
x = L * np.sin(theta_curr)
y = -L * np.cos(theta_curr)
# Draw pendulum
ax1.plot([0, x], [0, y], 'k-', lw=2) # Rod
ax1.plot(0, 0, 'ko', markersize=8) # Pivot point
ax1.plot(x, y, 'ro', markersize=15) # Bob
# Reference circle
circle_theta = np.linspace(0, 2*np.pi, 100)
circle_x = L * np.sin(circle_theta)
circle_y = -L * np.cos(circle_theta)
ax1.plot(circle_x, circle_y, 'b--', lw=0.5, alpha=0.3)
ax1.set_xlim(-1.5*L, 1.5*L)
ax1.set_ylim(-1.5*L, 0.5*L)
ax1.set_aspect('equal')
ax1.set_xlabel('$x$ (m)')
ax1.set_ylabel('$y$ (m)')
ax1.set_title(f'Pendulum Motion')
ax1.grid(True, alpha=0.3)
# Info box for pendulum
info_text = (
f"$t = {t_vals[frame]:.2f}$ s\n"
f"$\\theta = {theta_curr*180/np.pi:.1f}^\\circ$\n"
f"$\\omega = {omega_vals[frame]:.2f}$ rad/s"
)
ax1.text(0.02, 0.98, info_text,
transform=ax1.transAxes,
fontsize=9,
verticalalignment='top',
bbox=dict(boxstyle='round', facecolor='wheat', alpha=0.8))
# Right plot: Angle vs time
ax2.plot(t_vals[:frame+1], np.array(theta_vals[:frame+1]) * 180/np.pi,
'b-', lw=2)
ax2.plot(t_vals[frame], theta_vals[frame] * 180/np.pi,
'ro', markersize=6)
ax2.set_xlim(0, t_max)
ax2.set_ylim(-100, 100)
ax2.set_xlabel('Time $t$ (s)')
ax2.set_ylabel(r'Angle $\theta$ (degrees)')
ax2.set_title(r'$\theta$ vs $t$')
ax2.grid(True, alpha=0.3)
ax2.axhline(y=0, color='k', linestyle='--', lw=0.5, alpha=0.5)
# IVP info box at top
ivp_text = (
r"$\ddot{\theta}(t) + \frac{g}{L}\sin\theta(t) = 0, \quad \theta(0) = 90^\circ, \quad \dot{\theta}(0) = 0$"
)
fig.text(0.5, 0.96, ivp_text,
fontsize=11,
ha='center',
bbox=dict(boxstyle='round', facecolor='lightblue', alpha=0.8))
# Create animation with appropriate number of frames (sample every 5th frame for speed)
frame_skip = 5
frames = range(0, len(t_vals), frame_skip)
anim = FuncAnimation(fig, animate, frames=frames, interval=50, repeat=True)
plt.close()
mk.to_responsive_html(anim, container_id='pendulum-animation')We observed earlier that Euler’s method produces visible errors when compared to the exact solution. We now develop a quantitative understanding of these errors. How fast do errors accumulate? What happens when we make the step size smaller? These questions lead to the concepts of convergence and stability.
To understand how errors behave, we return to the Taylor series expansion. For a smooth function \(y(x)\), we can expand around a point \(x_i\):
\[ y(x_i+h) = y(x_i)+h y'(x_i)+\frac{h^2}{2}y''(x_i)+\frac{h^3}{6}y'''(x_i)+\cdots \]
The Euler method uses only the first two terms, \(y(x_i) + h y'(x_i)\), and discards the rest. This truncation is the source of error.
Consider a single step of Euler’s method. Suppose we start at the exact solution value, so \(y_i = y(x_i)\). After one step, we compute
\[ y_{i+1} = y_i + h f(x_i, y_i) = y(x_i) + h y'(x_i) \]
But the true solution at \(x_{i+1} = x_i + h\) is given by the Taylor expansion
\[ y(x_i + h) = y(x_i) + h y'(x_i) + \frac{h^2}{2}y''(x_i) + \frac{h^3}{6}y'''(x_i) + \cdots \]
The local truncation error is the difference between these values:
\[ e_{\text{local}} = y_{i+1} - y(x_i + h) = -\frac{h^2}{2}y''(x_i) - \frac{h^3}{6}y'''(x_i) - \cdots \]
Assuming the derivatives remain bounded, we can write \(e_{\text{local}} = O(h^2)\). This means the local error is proportional to \(h^2\). If we halve the step size, the local error reduces by a factor of roughly \(\left(\frac{1}{2}\right)^2 = \frac{1}{4}\).
The local error tells us what happens in a single step, but we take many steps to solve a problem from \(x=a\) to \(x=b\). The global truncation error measures the total accumulated error at the endpoint.
If we use step size \(h\), the number of steps from \(a\) to \(b\) is \(n = \frac{b-a}{h}\). At each step, we introduce a local error of order \(O(h^2)\). With \(n\) steps, these errors accumulate to give a global error of order
\[ e_{\text{global}} = O(n \cdot h^2) = O\left(\frac{b-a}{h} \cdot h^2\right) = O(h) \]
This is a crucial result: Euler’s method is first-order accurate. The global error is proportional to \(h\), not \(h^2\). Halving the step size cuts the global error in half, but requires twice as many steps. This explains why we observed visible errors even with \(h = 0.1\) in our introductory example: first-order methods need quite small step sizes to achieve high accuracy.
We say a numerical method is convergent if the global error approaches zero as the step size decreases, i.e., \(\|e_{\text{global}}\| \to 0\) as \(h \to 0\). Euler’s method is convergent: making \(h\) smaller does eventually give arbitrarily accurate results. However, this can require impractically small step sizes and long computation times for first-order methods.
A different concern is stability. A method is called stable if small perturbations in the input data (initial conditions or intermediate values) lead to small perturbations in the output. An unstable method amplifies errors catastrophically. Consider our pendulum simulation: if we used standard Euler instead of Euler-Cromer, we would see energy growing artificially over time due to instability. The system would eventually spiral outward rather than oscillate.
Stability depends not just on the method but also on the step size \(h\) and the problem being solved. For oscillatory problems like the pendulum, the standard Euler method requires very small \(h\) to remain stable, while Euler-Cromer remains stable with larger steps. This is why choosing the right numerical method for the problem at hand matters in practice.
Standard Euler method applied to the pendulum IVP, showing divergence from physical behavior over time.
Our theoretical analysis predicts that Euler’s method has global error \(O(h)\): halving the step size should roughly halve the error. But does this actually happen in practice? We can verify this numerically using our introductory example from Section 28.1.2.
For the problem \(y' = y\) with \(y(0) = 1\), we know the exact solution is \(y(x) = e^x\). We can run Euler’s method with different step sizes and measure how far the numerical solution deviates from this exact solution. To quantify the error, we compute the \(L^2\) error norm, which measures the overall difference between the approximate and exact solutions. On a discrete grid, this integral norm is approximated by:
\[ \|e\|_{L^2} = \sqrt{\int_a^b \left[ y_{\text{exact}}(x) - y_{\text{approx}}(x) \right]^2 dx} \approx \sqrt{h \sum_{i=0}^{N} \left[ y_{\text{exact}}(x_i) - y_{\text{approx}}(x_i) \right]^2} \]
This gives us a single number representing the total error. If our theory is correct, plotting \(\|e\|_{L^2}\) versus \(h\) on a log-log plot should produce a straight line with slope 1, confirming the \(O(h)\) convergence rate.
import numpy as np
import matplotlib.pyplot as plt
y_exact = lambda x: np.exp(x)
def euler_method(f, y0, x0, h, n_steps):
x_vals = [x0]
y_vals = [y0]
for _ in range(n_steps):
y_new = y_vals[-1] + h * f(x_vals[-1], y_vals[-1])
x_new = x_vals[-1] + h
x_vals.append(x_new)
y_vals.append(y_new)
return np.array(x_vals), np.array(y_vals)
f = lambda x, y: y
y0 = 1.0
x0 = 0.0
def compute_L2_error(f, y_exact, y0, x0, h, n_steps):
x_euler, y_euler = euler_method(f, y0, x0, h, n_steps)
y_exact_vals = y_exact(x_euler)
errors = np.abs(y_exact_vals - y_euler)
L2_error = np.sqrt(np.sum(errors**2) * h)
return L2_error
hs = [0.2, 0.1, 0.05, 0.025, 0.0125]
errors = []
for h in hs:
n_steps = int(1 / h)
L2_err = compute_L2_error(f, y_exact, y0, x0, h, n_steps)
errors.append(L2_err)
fig, ax = plt.subplots(figsize=(6, 4))
ax.loglog(hs, errors, 'o-', label=r"$L^2$ error")
ax.loglog(hs, [errors[0]*(h/hs[0]) for h in hs], 'k--', label='O(h)')
ax.set_xlabel('Step size $h$')
ax.set_ylabel("$L^2$ error")
ax.set_xticks(hs)
ax.set_xticklabels([f'${h}$' for h in hs])
ax.legend()
ax.grid(True, which="both", ls="--", alpha=0.5)
plt.show()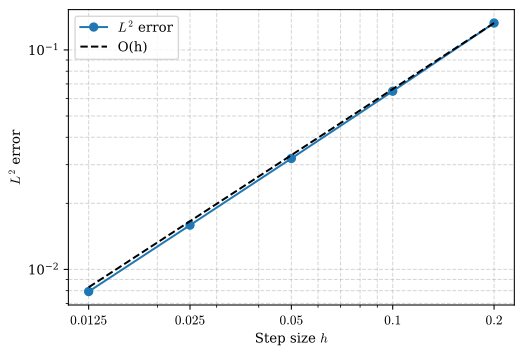
We can crealy see how the error decreases as we reduce the step size \(h\). Plotting the error against \(h\) on a log-log scale yields a straight line with a slope that is nearly 1, confirming the first-order convergence of Euler’s method.
Example 7.7.4 \[ (\mathrm{IVP}) \begin{cases} y^{\prime}(x)=1-2 x y & (\mathrm{ODE}) \\ y(0)=0 & (\mathrm{IV}) \end{cases} \]
We are looking for the solution on the interval \(x \in[0,1]\) using step size \(h=0.2\).
import numpy as np
import sympy as sp
import matplotlib.pyplot as plt
x = sp.symbols('x', real=True)
y = sp.Function('y')(x)
DE = sp.Eq(y.diff(x, 1), 1-2*x*y)
sol = sp.dsolve(DE, ics={y.subs(x, 0): 0})
# Pass 'scipy' as a module to handle special functions like erfi
y_exact = sp.lambdify(x, sol.rhs, modules=['numpy', 'scipy'])
sol\(\displaystyle y{\left(x \right)} = \frac{\sqrt{\pi} e^{- x^{2}} \operatorname{erfi}{\left(x \right)}}{2}\)
def euler_method(f, y0, x0, h, n_steps):
x_vals = [x0]
y_vals = [y0]
for _ in range(n_steps):
y_new = y_vals[-1] + h * f(x_vals[-1], y_vals[-1])
x_new = x_vals[-1] + h
x_vals.append(x_new)
y_vals.append(y_new)
return np.array(x_vals), np.array(y_vals)
f = lambda x, y: 1-2*x*y
y0 = 0.0
x0 = 0.0
n = 10; h = 2/n
x_euler, y_euler = euler_method(f, y0, x0, h, n)
x_fine = np.linspace(0, 2, 200)
y_fine = y_exact(x_fine)
plt.figure(figsize=(6, 4))
plt.plot(x_fine, y_fine, 'r-', lw=2, label='Exact Solution')
plt.plot(x_euler, y_euler, 'o-b', label='Euler Approximation')
plt.xlabel('$x$')
plt.ylabel('$y$')
plt.title("Euler's Method for $dy/dx = 1 - 2xy$")
plt.legend()
plt.grid(True, alpha=0.3)
plt.show() 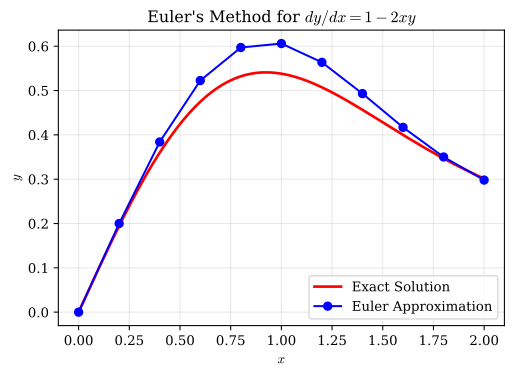
Example 7.7.5 A classical example of a linear ODE is a mass-spring-damper system, like a car suspension. Usually, this is a 2nd-order ODE, but we can look at a specific case of Terminal Velocity where a falling object reaches a constant speed due to air resistance. Imagine a skydiver jumping from a plane. The forces acting on the skydiver are gravity pulling down and air resistance pushing up, which is proportional to the velocity.
\[ m \frac{d v}{d t} = m g - c v \]
we get a first-order ODE:
\[ (\mathrm{IVP}) \begin{cases} \frac{d v}{d t} = g - \frac{cv}{m} & (\mathrm{ODE}) \\ v(0)=0 & (\mathrm{IV}) \end{cases} \]
This is interesting because as the skydiver falls, they speed up until the air resistance balances gravity, reaching a terminal velocity.
Let’s solve this numerically using Euler’s method with \(c=0.5\) and step size \(h=0.2\) over the interval \(t \in[0,10]\) seconds.
import numpy as np
import sympy as sp
import matplotlib.pyplot as plt
c = 2.5 # drag coefficient
g = 10
m = 100
# 1. Symbolic Solution
t = sp.symbols('t', real=True)
v = sp.Function('v')(t)
# dv/dt = 10 - 2v, starting from rest v(0)=0
DE = sp.Eq(v.diff(t), g - c*v/m)
sol = sp.dsolve(DE, ics={v.subs(t, 0): 0})
v_exact = sp.lambdify(t, sol.rhs, 'numpy')
# 2. Euler Method Setup
f_v = lambda t, v: g - c*v/m
t0, v0 = 0, 0
t_end = 200
h = 10
n = int((t_end - t0) / h)
t_euler, v_euler = euler_method(f_v, v0, t0, h, n)
v_t = sp.limit(sol.rhs, t, sp.oo)
# 3. Plotting
t_fine = np.linspace(0, t_end, 200)
plt.figure(figsize=(8, 5))
plt.plot(t_fine, v_exact(t_fine), 'r-', label='Exact (Terminal Velocity)')
plt.plot(t_euler, v_euler, 'o-b', label=f'Euler (h={h})')
plt.axhline(v_t, color='green', linestyle='--', label=f'Terminal Velocity ($v={v_t}$)')
plt.gca().text(0.98, 0.5, f'$y(t)={sp.latex(sol.rhs)}$',
transform=plt.gca().transAxes,
fontsize=14,
horizontalalignment='right',
bbox=dict(boxstyle='round', facecolor='white'))
plt.xlabel('Time (s)')
plt.ylabel('Velocity (m/s)')
plt.title("Falling Object with Drag")
plt.legend()
plt.grid(True, alpha=0.3)
plt.show()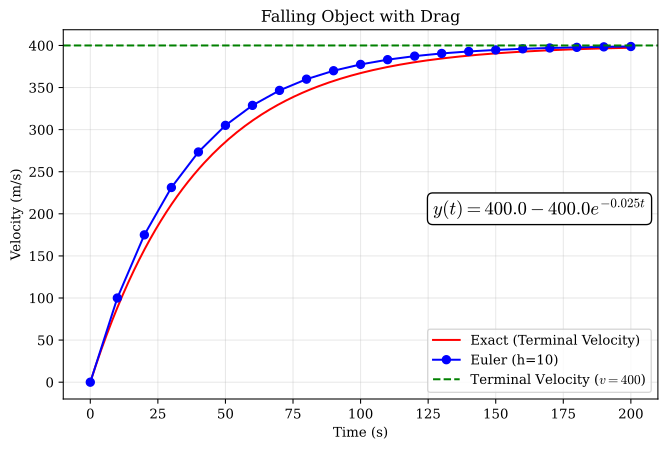
While Euler’s method provides a foundation for understanding time integration, more sophisticated methods achieve better accuracy for the (almost) same computational cost. These methods perform a reconnaissance, sampling the slope at multiple points before deciding the final step direction.
One such method is Heun’s method, also known as the improved Euler method or explicit trapezoidal rule. It is a simple yet effective way to enhance accuracy. The basic idea is to take an initial Euler step to estimate the slope at the next point, then average this with the slope at the current point to get a better overall estimate. Heun’s method proceeds as follows:
Thus, we have
\[ \boxed{ y_{i+1} = y_i + \frac{h}{2} \left[ f(x_i, y_i) + f\left(x_i + h, y_i + h f(x_i, y_i)\right) \right], \quad i = 0, 1, 2, \ldots } \]
This can be thought of as adding the average of two tangents:
\[ \left\{\begin{array}{l}k_1=h f\left(x_i, y_i\right) \\ k_2=h f\left(x_i+h, y_i+k_1\right)\end{array} \Rightarrow y_{i+1}=y_i+\frac{1}{2}\left(k_1+k_2\right), \quad i=0,1,2, \ldots\right. \]
We will return to the topic of error analysis in connection with the next method.
Here too, we venture from the point \((x_i, y_i)\) onto a reconnaissance mission in the direction \(y'=f(x_i, y_i)\), this time to the midpoint of the interval, \(\mathbf x_m = \left( x_i + \frac{h}{2}, y_i + \frac{h}{2}f(x_i, y_i) \right)\), where we sample the ODE, \(k = f(\mathbf x_m)\). The midpoint method then uses this slope to make the full step:
\[ \boxed{ y_{i+1} = y_i + h f\left( x_i + \frac{h}{2}, y_i + \frac{h}{2}f(x_i, y_i) \right), \quad i = 0, 1, 2, \ldots } \]
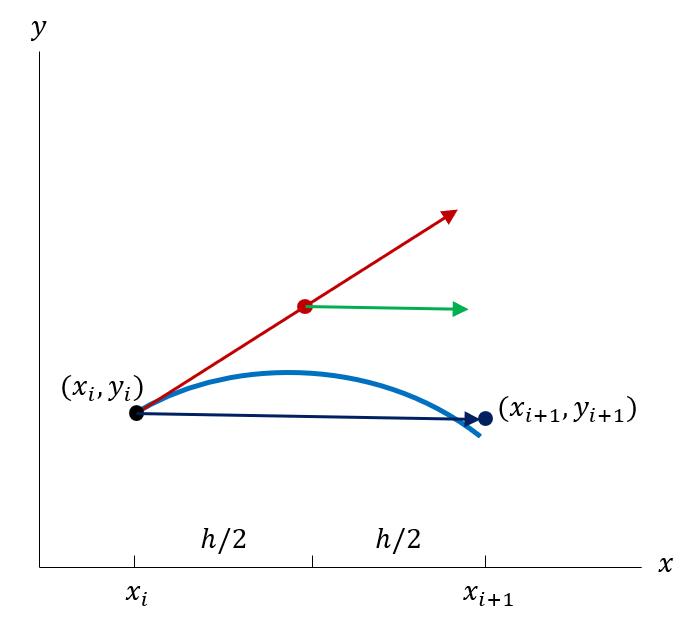
We can write the intial midpoint tangent as \(k_1 = hf(x_i, y_i)\) and thus the midpoint update can be expressed as
\[ y_{i+1} = y_i + h f\left( x_i + \frac{1}{2}h, y_i + \frac{1}{2}k_1 \right), \quad i = 0, 1, 2, \ldots \]
Example 7.7.6 Consider the initial value problem \(y'(x) = 1-2xy\) with \(y(0) = 0\) on the interval \(x \in [0,2]\). We will apply the midpoint method with step size \(h=0.2\).
import numpy as np
import matplotlib.pyplot as plt
from scipy.integrate import solve_ivp
# ODE: y' = 1 - 2*x*y
def f(x, y):
"""Right-hand side: y' = 1 - 2*x*y"""
return 1 - 2 * x * y
# Parameters
x0 = 0.0
y0 = 0.0
h = 0.2
x_end = 2.0
n_steps = int((x_end - x0) / h)
# Midpoint method
x_midpoint = [x0]
y_midpoint = [y0]
for i in range(n_steps):
x_curr = x_midpoint[-1]
y_curr = y_midpoint[-1]
# Midpoint method
k1 = f(x_curr, y_curr)
x_mid = x_curr + h/2
y_mid = y_curr + (h/2) * k1
k2 = f(x_mid, y_mid)
y_new = y_curr + h * k2
x_midpoint.append(x_curr + h)
y_midpoint.append(y_new)
# Exact solution using high-accuracy numerical integration
sol = solve_ivp(lambda t, y: f(t, y[0]), [x0, x_end], [y0],
method='DOP853', dense_output=True, rtol=1e-10)
x_exact = np.linspace(x0, x_end, 200)
y_exact = sol.sol(x_exact)[0]
# Create plot
fig, ax = plt.subplots(figsize=(10, 7), dpi=150)
ax.plot(x_exact, y_exact, 'r-', lw=3, label='Exact Solution', zorder=1)
ax.plot(x_midpoint, y_midpoint, 'o-b', lw=2.5, markersize=8,
label='Midpoint Method', zorder=2)
ax.set_xlabel('$x$', fontsize=14)
ax.set_ylabel('$y$', fontsize=14)
ax.set_title("Midpoint Method for $y' = 1 - 2xy$", fontsize=16, fontweight='bold')
ax.legend(fontsize=13, loc='upper right')
ax.grid(True, alpha=0.3)
# Calculate error
y_exact_at_end = sol.sol(x_end)[0]
error = abs(y_midpoint[-1] - y_exact_at_end)
# Add info box
info_text = (
r"ODE: $y' = 1 - 2xy$" + "\n"
r"IC: $y(0) = 0$" + "\n"
f"Step size: $h = {h}$\n"
f"\nAt $x = 2$:\n"
f"Exact: ${y_exact_at_end:.6f}$\n"
f"Midpoint: ${y_midpoint[-1]:.6f}$\n"
f"Error: ${error:.2e}$"
)
ax.text(0.02, 0.98, info_text,
transform=ax.transAxes,
fontsize=12,
verticalalignment='top',
horizontalalignment='left',
bbox=dict(boxstyle='round', facecolor='wheat', alpha=0.9))
plt.tight_layout()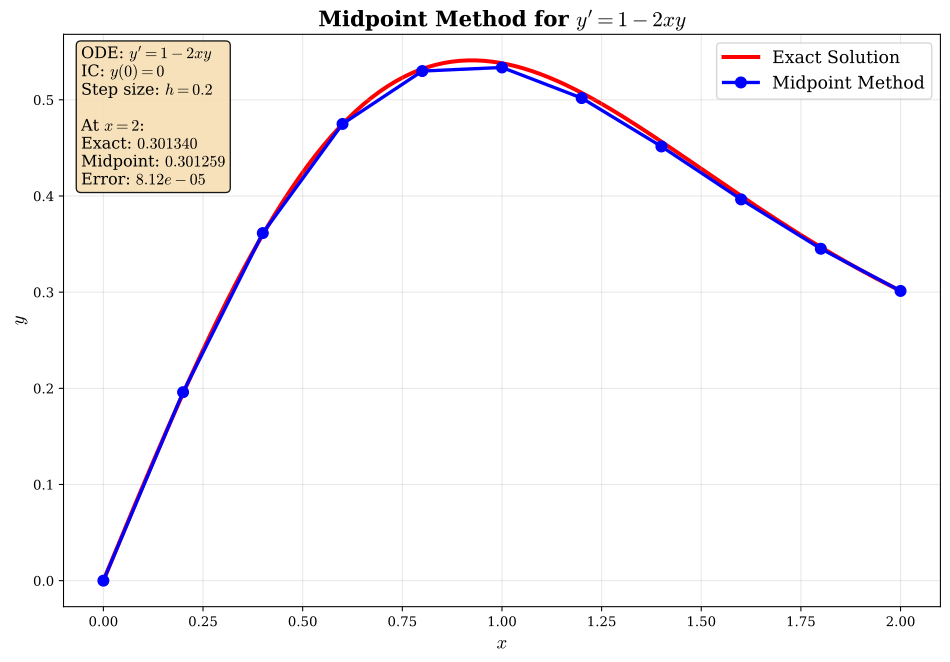
We now establish rigorously why both Heun’s method and the midpoint method achieve second-order accuracy. The key is to compare the Taylor expansion of the exact solution with the Taylor expansion of our numerical approximation and show that they agree up to terms of order \(h^2\).
Consider a general update formula of the form
\[ y_{i+1} = y_i + a_1 k_1 + a_2 k_2 \]
where \[ k_1 = h f(x_i, y_i), \quad k_2 = h f(x_i + \alpha h, y_i + \beta k_1) \]
The parameters \(a_1, a_2, \alpha, \beta\) are to be determined such that the method achieves second-order accuracy. We proceed by expanding both the exact solution and our approximation in Taylor series, then matching coefficients.
The exact solution \(y(x)\) satisfies the differential equation \(y'(x) = f(x, y)\). Expanding \(y(x_{i+1}) = y(x_i + h)\) in a Taylor series around \(x_i\) gives
\[ y(x_i + h) = y(x_i) + h y'(x_i) + \frac{h^2}{2} y''(x_i) + \frac{h^3}{6} y'''(x_i) + O(h^4) \]
Since \(y'(x_i) = f(x_i, y_i)\), we need to express the higher derivatives in terms of \(f\). Using the chain rule,
\[ y''(x_i) = \frac{d}{dx} f(x, y) \bigg|_{x=x_i} = \frac{\partial f}{\partial x} + \frac{\partial f}{\partial y} \frac{dy}{dx} = f_x + f_y f \]
where we use the subscript notation \(f_x = \partial f/\partial x\) and \(f_y = \partial f/\partial y\), all evaluated at \((x_i, y_i)\). Substituting this into the Taylor expansion,
\[ y(x_i + h) = y_i + h f + \frac{h^2}{2}(f_x + f_y f) + O(h^3) \tag{7.7.7}\]
This is our target: the numerical method should reproduce these first three terms to achieve second-order local accuracy.
We now expand the term \(k_2 = h f(x_i + \alpha h, y_i + \beta k_1)\) using a two-variable Taylor expansion of \(f(x, y)\) around the point \((x_i, y_i)\):
\[ f(x_i + \alpha h, y_i + \beta k_1) = f + \alpha h f_x + \beta k_1 f_y + O(h^2) \]
Since \(k_1 = hf\), we have \(\beta k_1 = \beta h f\), giving
\[ k_2 = h \left[ f + \alpha h f_x + \beta h f f_y + O(h^2) \right] = hf + \alpha h^2 f_x + \beta h^2 f f_y + O(h^3) \]
Substituting \(k_1 = hf\) and this expression for \(k_2\) into our ansatz,
\[ \begin{align} y_{i+1} &= y_i + a_1 (hf) + a_2 (hf + \alpha h^2 f_x + \beta h^2 f f_y) + O(h^3) \\ &= y_i + (a_1 + a_2)hf + a_2 \alpha h^2 f_x + a_2 \beta h^2 f f_y + O(h^3) \end{align} \]
Comparing this with the exact solution (7.7.7), we require
\[ \begin{align} \text{Coefficient of } h: \quad & a_1 + a_2 = 1 \\ \text{Coefficient of } h^2 f_x: \quad & a_2 \alpha = \frac{1}{2} \\ \text{Coefficient of } h^2 f f_y: \quad & a_2 \beta = \frac{1}{2} \end{align} \]
These three equations constrain our four parameters. Any choice satisfying these conditions yields a second-order method.
Heun’s Method corresponds to \(a_1 = a_2 = 1/2\), \(\alpha = \beta = 1\) which satisfies the conditions.
Midpoint Method corresponds to \(a_1 = 0\), \(a_2 = 1\), \(\alpha = \beta = 1/2\) which also satisfies the conditions.
Both methods satisfy the conditions, confirming they are second-order accurate.
We have shown that the local truncation error (the error introduced in a single step, assuming we start from the exact solution) is \(O(h^3)\). When we accumulate these errors over many steps from \(x = a\) to \(x = b\), the number of steps is \(n = (b-a)/h\). Each step contributes an error of order \(h^3\), so the total accumulated error is
\[ \text{Global error} = O(n \cdot h^3) = O\left(\frac{b-a}{h} \cdot h^3\right) = O(h^2) \]
Thus, both Heun’s method and the midpoint method have global error \(O(h^2)\). Compared to Euler’s method, which has global error \(O(h)\), these second-order methods are significantly more accurate for the same step size. Halving the step size reduces the global error by a factor of approximately four for second-order methods, versus only a factor of two for Euler’s method.
Following the same analytical approach developed in Section 28.8, we can derive methods of even higher order. The Taylor expansion framework and coefficient matching technique generalize naturally to methods with global error \(O(h^p)\) for \(p = 3, 4, \ldots\). The most widely used higher-order method achieves fourth-order accuracy, \(O(h^4)\), and is known simply as the Runge-Kutta method or RK4. In fact, all the methods we have encountered can be viewed as members of the Runge-Kutta family, differing only in their order of accuracy. Thus, Euler’s method is a first-order Runge-Kutta method, while Heun’s and the midpoint method are second-order Runge-Kutta methods.
The progression from Euler to Heun to RK4 follows a clear pattern: we sample the slope at increasingly many reconnaissance points to build a more accurate weighted average. Euler’s method samples at one point (the current location), Heun’s method samples at two points (the current point and a forward projection), and RK4 samples at four strategically chosen points. These four samples combine to produce a weighted average that matches the Taylor expansion up to terms of order \(h^4\), yielding dramatically improved accuracy compared to lower-order methods.
The classical fourth-order Runge-Kutta method computes four slope samples \(k_1, k_2, k_3, k_4\) at each step, then forms a weighted average to update the solution. The first sample \(k_1\) evaluates the slope at the current point \((x_i, y_i)\), just as in Euler’s method. The second sample \(k_2\) uses this slope to project halfway to the next step, evaluating the slope at the midpoint. The third sample \(k_3\) uses the second slope to make a revised midpoint projection, and the fourth sample \(k_4\) uses the third slope to project all the way to the endpoint. These four samples are then combined with weights that ensure fourth-order accuracy.
Mathematically, the RK4 update formula is
\[ \boxed{ y_{i+1} = y_i + \frac{1}{6}(k_1 + 2k_2 + 2k_3 + k_4), \quad i = 0, 1, 2, \ldots } \]
where the slope samples are computed as
\[ \begin{align} k_1 &= h f(x_i, y_i) \\ k_2 &= h f\left(x_i + \frac{h}{2}, y_i + \frac{k_1}{2}\right) \\ k_3 &= h f\left(x_i + \frac{h}{2}, y_i + \frac{k_2}{2}\right) \\ k_4 &= h f(x_i + h, y_i + k_3) \end{align} \]
Note the structure of these formulas. Each \(k_j\) represents not just a slope but a slope increment: the product of step size \(h\) and the function value \(f\) evaluated at some intermediate point. The weights in the final average are \(\frac{1}{6}\), \(\frac{2}{6}\), \(\frac{2}{6}\), \(\frac{1}{6}\), which sum to 1 as required for consistency. The midpoint samples \(k_2\) and \(k_3\) receive double weight compared to the endpoint samples \(k_1\) and \(k_4\), reflecting the higher accuracy of slope information obtained near the middle of the interval.
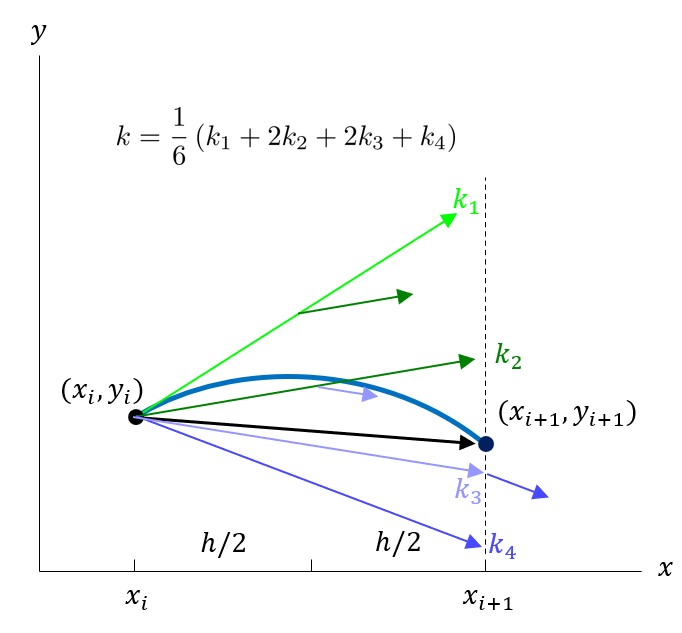
The improved accuracy of RK4 comes at a cost: we must evaluate the function \(f\) four times per step instead of once (Euler) or twice (Heun, midpoint). However, this increased cost often proves worthwhile. Because the error decreases as \(h^4\) rather than \(h^2\) or \(h\), we can use much larger step sizes while maintaining acceptable accuracy. For many problems, RK4 with step size \(h\) produces comparable accuracy to Euler’s method with step size \(h/10\) or smaller, requiring far fewer total function evaluations despite the higher cost per step.
This trade-off between function evaluations per step and achievable step size represents a fundamental consideration in numerical differential equations. Higher-order methods enable larger steps but cost more per step. The optimal choice depends on the problem: for smooth solutions where large steps are stable, high-order methods excel. For problems with rapid variations or strict stability constraints that force small steps regardless of accuracy, lower-order methods may suffice.
The derivation of RK4 follows the same Taylor expansion approach used in Section 28.8, but with more terms. We assume a general ansatz
\[ y_{i+1} = y_i + a_1 k_1 + a_2 k_2 + a_3 k_3 + a_4 k_4 \]
with
\[ \begin{align} k_1 &= h f(x_i, y_i) \\ k_2 &= h f(x_i + \alpha_2 h, y_i + \beta_{21} k_1) \\ k_3 &= h f(x_i + \alpha_3 h, y_i + \beta_{31} k_1 + \beta_{32} k_2) \\ k_4 &= h f(x_i + \alpha_4 h, y_i + \beta_{41} k_1 + \beta_{42} k_2 + \beta_{43} k_3) \end{align} \]
Expanding both the exact solution and the approximation in Taylor series up to \(O(h^5)\) and matching coefficients of \(h, h^2, h^3, h^4\) gives a system of algebraic equations in the parameters \(a_i, \alpha_i, \beta_{ij}\). This system is underdetermined: many parameter choices yield fourth-order accuracy. The classical RK4 method represents one particular solution to these equations, chosen for its simplicity and symmetric structure. Other fourth-order Runge-Kutta methods exist with different parameter values, trading various properties like stability region size or suitability for stiff equations.
We omit the detailed coefficient matching algebra, which becomes tedious for fourth-order methods, focusing instead on the resulting formulas and their practical application. For detailed derivations of the fourth‑order Runge–Kutta order conditions and classifications of RK4 schemes, see [4] and [5], as well as the exposition in [6] and [7].
Example 7.7.7 Consider the initial value problem \(y'(x) = x + y\) with \(y(0) = 1\) on the interval \(x \in [0,0.4]\). We will apply the RK4 method with step size \(h=0.1\) to demonstrate the four-stage computation process in detail.
from IPython.display import Markdown
import pandas as pd
# RK4 method with detailed markdown table output
def f(x, y):
return x + y
# Parameters
x0, y0 = 0.0, 1.0
h = 0.1
x_end = 0.4
n_steps = int((x_end - x0) / h)
# Build table data
table_rows = []
x_i, y_i = x0, y0
for step in range(n_steps):
# Compute k values
k1 = h * f(x_i, y_i)
k2 = h * f(x_i + h/2, y_i + k1/2)
k3 = h * f(x_i + h/2, y_i + k2/2)
k4 = h * f(x_i + h, y_i + k3)
# Row 1: Current state (k1 computation)
table_rows.append({
'x': f"{x_i:.1f}",
'y': f"{y_i:.5g}",
"y' = x+y": f"{f(x_i, y_i):.5g}",
"hy'": f"{k1:.5g}"
})
# Row 2: First midpoint (k2 computation)
table_rows.append({
'x': f"{x_i + h/2:.1f}",
'y': f"{y_i + k1/2:.5g}",
"y' = x+y": f"{f(x_i + h/2, y_i + k1/2):.5g}",
"hy'": f"{k2:.5g}"
})
# Row 3: Second midpoint (k3 computation)
table_rows.append({
'x': f"{x_i + h/2:.1f}",
'y': f"{y_i + k2/2:.5g}",
"y' = x+y": f"{f(x_i + h/2, y_i + k2/2):.5g}",
"hy'": f"{k3:.5g}"
})
# Row 4: Endpoint (k4 computation)
table_rows.append({
'x': f"{x_i + h:.1f}",
'y': f"{y_i + k3:.5g}",
"y' = x+y": f"{f(x_i + h, y_i + k3):.5g}",
"hy'": f"{k4:.5g}"
})
# Row 5: Weighted average
weighted_avg = (k1 + 2*k2 + 2*k3 + k4) / 6
table_rows.append({
'x': "",
'y': "",
"y' = x+y": "",
"hy'": f"$\\frac{{1}}{{6}} \\cdot {k1 + 2*k2 + 2*k3 + k4:.5g} = {weighted_avg:.5g}$"
})
# Update for next iteration
y_i = y_i + weighted_avg
x_i = x_i + h
# Row 6: Updated value
table_rows.append({
'x': f"**{x_i:.1f}**",
'y': f"**{y_i:.5g}**",
"y' = x+y": "",
"hy'": ""
})
# Create DataFrame
df = pd.DataFrame(table_rows)
# Display as markdown table
display(Markdown(df.to_markdown(index=False)))| x | y | y’ = x+y | hy’ |
|---|---|---|---|
| 0.0 | 1 | 1 | 0.1 |
| 0.1 | 1.05 | 1.1 | 0.11 |
| 0.1 | 1.055 | 1.105 | 0.1105 |
| 0.1 | 1.1105 | 1.2105 | 0.12105 |
| \(\frac{1}{6} \cdot 0.66205 = 0.11034\) | |||
| 0.1 | 1.1103 | ||
| 0.1 | 1.1103 | 1.2103 | 0.12103 |
| 0.2 | 1.1709 | 1.3209 | 0.13209 |
| 0.2 | 1.1764 | 1.3264 | 0.13264 |
| 0.2 | 1.243 | 1.443 | 0.1443 |
| \(\frac{1}{6} \cdot 0.79478 = 0.13246\) | |||
| 0.2 | 1.2428 | ||
| 0.2 | 1.2428 | 1.4428 | 0.14428 |
| 0.2 | 1.3149 | 1.5649 | 0.15649 |
| 0.2 | 1.3211 | 1.5711 | 0.15711 |
| 0.3 | 1.3999 | 1.6999 | 0.16999 |
| \(\frac{1}{6} \cdot 0.94147 = 0.15691\) | |||
| 0.3 | 1.3997 | ||
| 0.3 | 1.3997 | 1.6997 | 0.16997 |
| 0.4 | 1.4847 | 1.8347 | 0.18347 |
| 0.4 | 1.4915 | 1.8415 | 0.18415 |
| 0.4 | 1.5839 | 1.9839 | 0.19839 |
| \(\frac{1}{6} \cdot 1.1036 = 0.18393\) | |||
| 0.4 | 1.5836 |
import numpy as np
import matplotlib.pyplot as plt
from scipy.integrate import solve_ivp
# ODE: y' = x + y
def f(x, y):
"""Right-hand side: y' = x + y"""
return x + y
# Parameters
x0 = 0.0
y0 = 1.0
h = 0.1
x_end = 0.4
n_steps = int((x_end - x0) / h)
# RK4 method
x_rk4 = [x0]
y_rk4 = [y0]
for i in range(n_steps):
x_i = x_rk4[-1]
y_i = y_rk4[-1]
k1 = h * f(x_i, y_i)
k2 = h * f(x_i + h/2, y_i + k1/2)
k3 = h * f(x_i + h/2, y_i + k2/2)
k4 = h * f(x_i + h, y_i + k3)
y_new = y_i + (k1 + 2*k2 + 2*k3 + k4) / 6
x_rk4.append(x_i + h)
y_rk4.append(y_new)
# Exact solution using high-accuracy numerical integration
sol = solve_ivp(lambda t, y: f(t, y[0]), [x0, x_end], [y0],
method='DOP853', dense_output=True, rtol=1e-10)
x_exact = np.linspace(x0, x_end, 200)
y_exact = sol.sol(x_exact)[0]
# Create plot
fig, ax = plt.subplots(figsize=(10, 7), dpi=150)
ax.plot(x_exact, y_exact, 'r-', lw=3, label='Exact Solution', zorder=1)
ax.plot(x_rk4, y_rk4, 'o-b', lw=2.5, markersize=8,
label='RK4 Method', zorder=2)
ax.set_xlabel('$x$', fontsize=14)
ax.set_ylabel('$y$', fontsize=14)
ax.set_title("RK4 Method for $y' = x + y$", fontsize=16, fontweight='bold')
ax.legend(fontsize=13, loc='upper left')
ax.grid(True, alpha=0.3)
# Calculate error
y_exact_at_end = sol.sol(x_end)[0]
error = abs(y_rk4[-1] - y_exact_at_end)
# Add info box
info_text = (
r"ODE: $y' = x + y$" + "\n"
r"IC: $y(0) = 1$" + "\n"
f"Step size: $h = {h}$\n"
f"\nAt $x = {x_end}$:\n"
f"Exact: ${y_exact_at_end:.6f}$\n"
f"RK4: ${y_rk4[-1]:.6f}$\n"
f"Error: ${error:.2e}$"
)
ax.text(0.02, 0.85, info_text,
transform=ax.transAxes,
fontsize=12,
verticalalignment='top',
horizontalalignment='left',
bbox=dict(boxstyle='round', facecolor='wheat', alpha=0.9))
plt.tight_layout()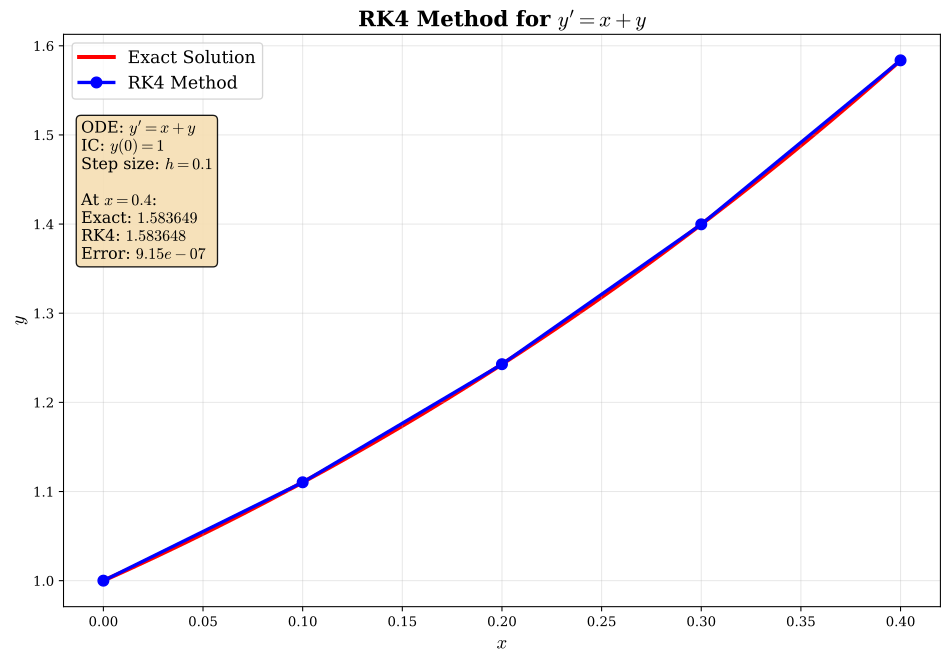
Scipy Implementation of RK4Consider the initial value problem \(y'(x) = y - x^2 + 1\) with \(y(0) = 0.5\) on the interval \(x \in [0,0.4]\). We will apply the RK4 method using scipy.integrate.solve_ivp with step size \(h=0.1\) to demonstrate its usage in Python.
import numpy as np
from scipy.integrate import solve_ivp
import matplotlib.pyplot as plt
# Define the ODE function
def f(x, y):
return y - x**2 + 1
# Initial conditions
x0 = 0
y0 = 0.5
# Interval and step size
x_end = 0.4
h = 0.1
# Create an array of time points where the solution is computed
t_eval = np.arange(x0, x_end + h, h)
# Solve the ODE using RK4 method
sol = solve_ivp(f, [x0, x_end], [y0], method='RK45', t_eval=t_eval)
# Exact solution for comparison
def exact_solution(x):
return (x + 1)**2 - 0.5 * np.exp(x)
t_fine = np.linspace(x0, x_end, 100)
# Plot the results
plt.plot(t_fine, exact_solution(t_fine), 'r-', lw=4, label='Exact Solution')
plt.plot(sol.t, sol.y[0], 'o-b', label='RK4 Approximation')
plt.gca().text(0.05, 0.7, r'$y(x) = (x + 1)^2 - \frac{1}{2} e^{x}$',
transform=plt.gca().transAxes,
fontsize=14,
horizontalalignment='left',
bbox=dict(boxstyle='round', facecolor='white'))
plt.xlabel('$x$')
plt.ylabel('$y$')
plt.legend()
plt.title('RK4 Method vs Exact Solution')
plt.show()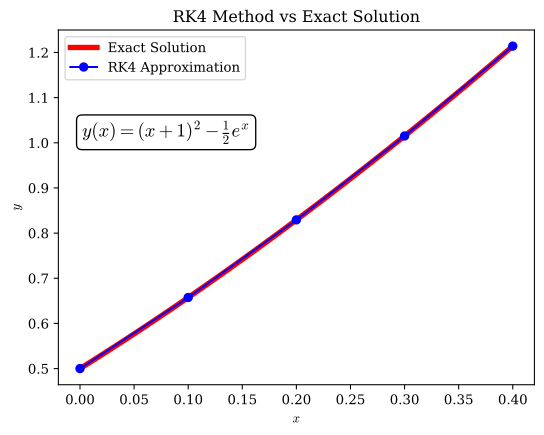
Consider the initial value problem \(y'(x) = 1-2xy\) with \(y(0) = 0\) on the interval \(x \in [0,2]\) using step size \(h=0.2\). We compare all four methods side by side.
import numpy as np
import matplotlib.pyplot as plt
from scipy.integrate import solve_ivp
# ODE: y' = 1 - 2*x*y
def f(x, y):
return 1 - 2 * x * y
# Parameters
x0 = 0.0
y0 = 0.0
h = 0.2
x_end = 2.0
n_steps = int((x_end - x0) / h)
# Euler's method
x_euler = [x0]
y_euler = [y0]
for i in range(n_steps):
x_i, y_i = x_euler[-1], y_euler[-1]
y_new = y_i + h * f(x_i, y_i)
x_euler.append(x_i + h)
y_euler.append(y_new)
# Heun's method
x_heun = [x0]
y_heun = [y0]
for i in range(n_steps):
x_i, y_i = x_heun[-1], y_heun[-1]
k1 = f(x_i, y_i)
k2 = f(x_i + h, y_i + h * k1)
y_new = y_i + (h/2) * (k1 + k2)
x_heun.append(x_i + h)
y_heun.append(y_new)
# Midpoint method
x_midpoint = [x0]
y_midpoint = [y0]
for i in range(n_steps):
x_i, y_i = x_midpoint[-1], y_midpoint[-1]
k1 = f(x_i, y_i)
k2 = f(x_i + h/2, y_i + (h/2) * k1)
y_new = y_i + h * k2
x_midpoint.append(x_i + h)
y_midpoint.append(y_new)
# RK4 method
x_rk4 = [x0]
y_rk4 = [y0]
for i in range(n_steps):
x_i, y_i = x_rk4[-1], y_rk4[-1]
k1 = h * f(x_i, y_i)
k2 = h * f(x_i + h/2, y_i + k1/2)
k3 = h * f(x_i + h/2, y_i + k2/2)
k4 = h * f(x_i + h, y_i + k3)
y_new = y_i + (k1 + 2*k2 + 2*k3 + k4) / 6
x_rk4.append(x_i + h)
y_rk4.append(y_new)
# Exact solution
sol = solve_ivp(lambda t, y: f(t, y[0]), [x0, x_end], [y0],
method='DOP853', dense_output=True, rtol=1e-12)
x_exact = np.linspace(x0, x_end, 200)
y_exact = sol.sol(x_exact)[0]
# Create plot
fig, ax = plt.subplots(figsize=(12, 8), dpi=150)
ax.plot(x_exact, y_exact, 'k-', lw=3, label='Exact Solution', zorder=1)
ax.plot(x_euler, y_euler, 'o-', lw=2, markersize=6, label="Euler's Method", zorder=2)
ax.plot(x_heun, y_heun, 's-', lw=2, markersize=6, label="Heun's Method", zorder=3)
ax.plot(x_midpoint, y_midpoint, '^-', lw=2, markersize=6, label='Midpoint Method', zorder=4)
ax.plot(x_rk4, y_rk4, 'd-', lw=2, markersize=6, label='RK4 Method', zorder=5)
ax.set_xlabel('$x$', fontsize=14)
ax.set_ylabel('$y$', fontsize=14)
ax.set_title("Comparison of Time Integration Methods for $y' = 1 - 2xy$",
fontsize=16, fontweight='bold')
ax.legend(fontsize=12, loc='upper right')
ax.grid(True, alpha=0.3)
# Calculate errors at endpoint
y_exact_end = sol.sol(x_end)[0]
error_euler = abs(y_euler[-1] - y_exact_end)
error_heun = abs(y_heun[-1] - y_exact_end)
error_midpoint = abs(y_midpoint[-1] - y_exact_end)
error_rk4 = abs(y_rk4[-1] - y_exact_end)
# Add info box
info_text = (
r"ODE: $y' = 1 - 2xy$" + "\n"
r"IC: $y(0) = 0$" + "\n"
f"Step size: $h = {h}$\n"
f"\nError at $x = {x_end}$:\n"
f"Euler: ${error_euler:.2e}$\n"
f"Heun: ${error_heun:.2e}$\n"
f"Midpoint: ${error_midpoint:.2e}$\n"
f"RK4: ${error_rk4:.2e}$"
)
ax.text(0.02, 0.98, info_text,
transform=ax.transAxes,
fontsize=11,
verticalalignment='top',
horizontalalignment='left',
bbox=dict(boxstyle='round', facecolor='wheat', alpha=0.9),
family='monospace')
plt.tight_layout()
plt.show()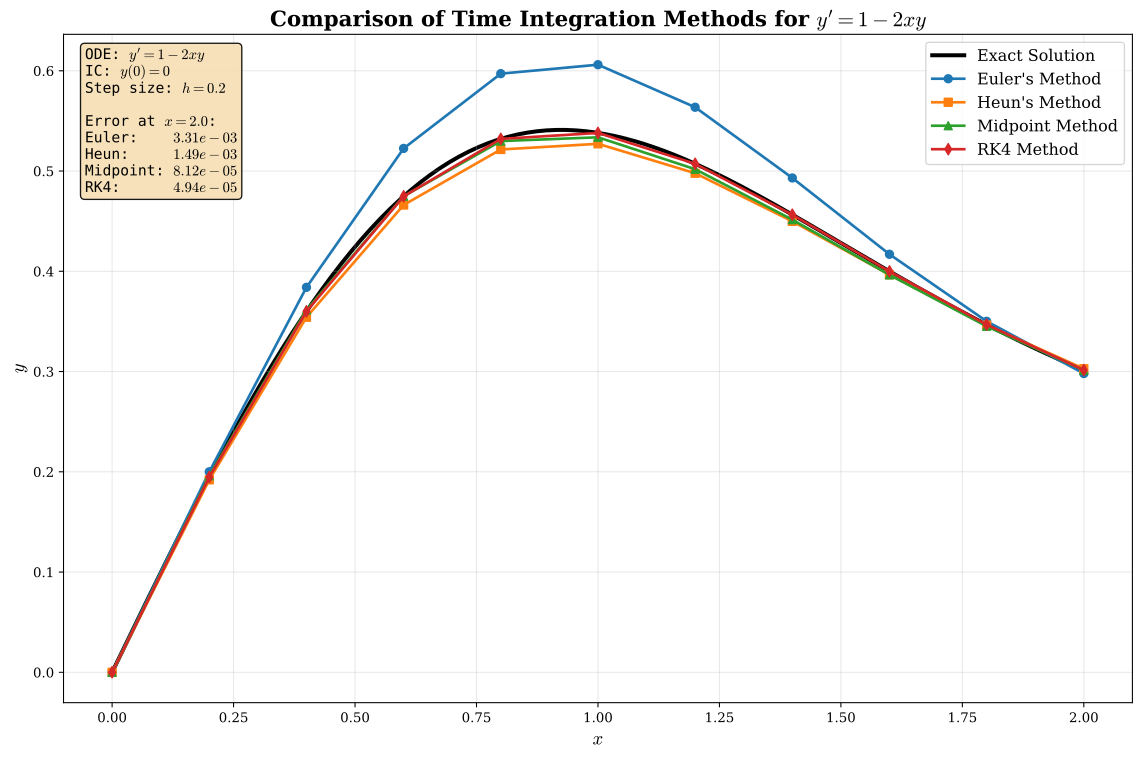
To quantify the accuracy of each method, we now examine how the error decreases as we reduce the step size \(h\). For a method of order \(p\), we expect the global error to scale as \(O(h^p)\). On a log-log plot, this appears as a straight line with slope \(p\).
Having explored Euler’s method, Heun’s method, the midpoint method, and RK4, we now compare their performance on the same initial value problem. This comparison illustrates the accuracy improvement achieved by higher-order methods and demonstrates the practical trade-offs between computational cost and precision.
#| code-fold: true
import numpy as np
import matplotlib.pyplot as plt
from scipy.integrate import solve_ivp
from matplotlib.ticker import FixedLocator, ScalarFormatter
# ODE: y' = 1 - 2*x*y
def f(x, y):
return 1 - 2 * x * y
# Parameters
x0 = 0.0
y0 = 0.0
x_end = 2.0
# Step sizes to test
step_sizes = [0.4, 0.2, 0.1, 0.05, 0.025, 0.0125]
# Storage for errors
errors_euler = []
errors_heun = []
errors_midpoint = []
errors_rk4 = []
# Get exact solution at x_end
sol_exact = solve_ivp(lambda t, y: f(t, y[0]), [x0, x_end], [y0],
method='DOP853', dense_output=True, rtol=1e-12)
y_exact_end = sol_exact.sol(x_end)[0]
# Compute errors for each step size
for h in step_sizes:
n_steps = int((x_end - x0) / h)
# Euler's method
x_i, y_i = x0, y0
for _ in range(n_steps):
y_i = y_i + h * f(x_i, y_i)
x_i = x_i + h
errors_euler.append(abs(y_i - y_exact_end))
# Heun's method
x_i, y_i = x0, y0
for _ in range(n_steps):
k1 = f(x_i, y_i)
k2 = f(x_i + h, y_i + h * k1)
y_i = y_i + (h/2) * (k1 + k2)
x_i = x_i + h
errors_heun.append(abs(y_i - y_exact_end))
# Midpoint method
x_i, y_i = x0, y0
for _ in range(n_steps):
k1 = f(x_i, y_i)
k2 = f(x_i + h/2, y_i + (h/2) * k1)
y_i = y_i + h * k2
x_i = x_i + h
errors_midpoint.append(abs(y_i - y_exact_end))
# RK4 method
x_i, y_i = x0, y0
for _ in range(n_steps):
k1 = h * f(x_i, y_i)
k2 = h * f(x_i + h/2, y_i + k1/2)
k3 = h * f(x_i + h/2, y_i + k2/2)
k4 = h * f(x_i + h, y_i + k3)
y_i = y_i + (k1 + 2*k2 + 2*k3 + k4) / 6
x_i = x_i + h
errors_rk4.append(abs(y_i - y_exact_end))
# Create convergence plot
fig, ax = plt.subplots(figsize=(10, 8), dpi=150)
ax.loglog(step_sizes, errors_euler, 'o-', lw=2.5, markersize=8,
label="Euler (Order 1)", color='C0')
ax.loglog(step_sizes, errors_heun, 's-', lw=2.5, markersize=8,
label="Heun (Order 2)", color='C1')
ax.loglog(step_sizes, errors_midpoint, '^-', lw=2.5, markersize=8,
label='Midpoint (Order 2)', color='C2')
ax.loglog(step_sizes, errors_rk4, 'd-', lw=2.5, markersize=8,
label='RK4 (Order 4)', color='C3')
# Add reference lines showing theoretical slopes
h_ref = np.array(step_sizes)
ax.loglog(h_ref, errors_euler[0] * (h_ref/step_sizes[0])**1,
'k--', lw=1.5, alpha=0.5, label='$O(h)$')
ax.loglog(h_ref, errors_heun[0] * (h_ref/step_sizes[0])**2,
'k:', lw=1.5, alpha=0.5, label='$O(h^2)$')
ax.loglog(h_ref, errors_rk4[0] * (h_ref/step_sizes[0])**4,
'k-.', lw=1.5, alpha=0.5, label='$O(h^4)$')
ax.set_xlabel('Step size $h$', fontsize=14)
ax.set_ylabel('Absolute error at $x = 2$', fontsize=14)
ax.set_title('Convergence Rates of Time Integration Methods',
fontsize=16, fontweight='bold')
ax.legend(fontsize=11, loc='lower right')
ax.grid(True, which="both", ls="-", alpha=0.3)
# ax.set_xticks([0.4, 0.2, 0.1, 0.05, 0.025, 0.0125])
# ax.set_xticklabels(['0.4', '0.2', '0.1', '0.05', '0.025', '0.0125'])
ax.xaxis.set_major_locator(FixedLocator(step_sizes))
ax.xaxis.set_major_formatter(ScalarFormatter())
# Add text annotation
annotation_text = (
"Theoretical convergence rates:\n"
"Euler: $O(h^1)$ - slope = 1\n"
"Heun/Midpoint: $O(h^2)$ - slope = 2\n"
"RK4: $O(h^4)$ - slope = 4"
)
ax.text(0.60, 0.02, annotation_text,
transform=ax.transAxes,
fontsize=10,
verticalalignment='bottom',
horizontalalignment='right',
bbox=dict(boxstyle='round', facecolor='lightblue', alpha=0.9))
plt.tight_layout()
plt.show()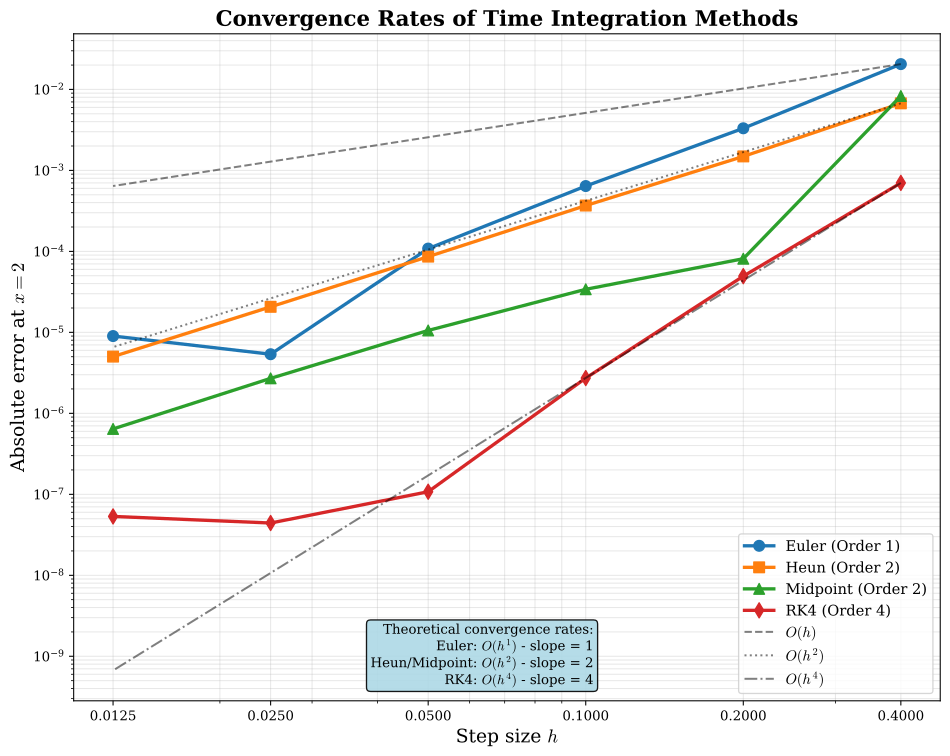
Note that the RK4 method stops converging around \(h \approx 0.025\) with an error floor near \(10^{-7}\). This is not due to DOP853’s accuracy (which is \(\sim 10^{-12}\) with rtol=1e-12), but rather due to floating-point round-off error.
Every numerical method has two competing error sources: - Truncation error: \(\propto h^4\) for RK4 (decreases as \(h \to 0\)) - Round-off error: \(\propto \frac{n \cdot \epsilon_{\text{machine}}}{h}\) where \(n = (b-a)/h\) is the number of steps
As we reduce \(h\), truncation error decreases but we must take more steps, accumulating more round-off errors. These competing effects create an optimal step size that minimizes total error. For RK4 with double-precision arithmetic, this typically occurs around \(h \approx 0.01\)-\(0.1\), giving an error floor of \(10^{-7}\) to \(10^{-11}\) depending on the problem.
This is a fundamental limitation of finite-precision floating-point arithmetic, not a deficiency of the method itself.
Observe that Euler’s method appears to converge faster than its theoretical \(O(h)\) rate for this particular problem. On the log-log plot, the slope is noticeably steeper than 1. This is an example of super-convergence - when a numerical method performs better than its worst-case theoretical analysispredicts.
This occurs because convergence theory provides asymptotic bounds valid for all problems. For specific ODEs with particular structures, error terms can cancel or reduce, leading to better practical performance. However, you cannot rely on super-convergence in general - it depends critically on the problemstructure.
The theoretical rates (\(O(h)\), \(O(h^2)\), \(O(h^4)\)) remain the guaranteed worst-case bounds you can depend on across all problems.
DOP853 is used because we need a reference “exact” solution to compare against our numerical methods (Euler, Heun, Midpoint, RK4), but the ODE \(y' = 1-2xy\) doesn’t have a simple closed-form analytical solution.
DOP853 is a Dormand-Prince 8th-order Runge-Kutta method with very high accuracy:
dense_output=Truescipy.integrate.solve_ivp as well as ODE45 in MATLAB.When we set rtol=1e-12, DOP853 achieves errors around \(10^{-12}\) or better, which is essentially “machine precision exact” compared to our methods being tested (which have errors around \(10^{-2}\) to \(10^{-6}\)).
Alternative approaches we could have used:
DOP853’s error is so small compared to the methods we’re testing that we can treat it as the “true” solution for practical purposes.
In all the methods we have examined so far, Euler’s method, Heun’s method, the midpoint method, and the Runge-Kutta methods, we computed \(y_{i+1}\) explicitly from known quantities at \(x_i\). These are called explicit/forward methods or because the new value \(y_{i+1}\) can be calculated directly using a formula that involves only previously computed values.
We now consider a fundamentally different class of methods called implicit/backward methods , where the unknown value \(y_{i+1}\) appears on both sides of the update equation. This seemingly inconvenient feature comes with a significant advantage: implicit methods can have superior stability properties, particularly for stiff differential equations where explicit methods require impractically small step sizes.
The distinction arises from how we approximate the derivative. Explicit methods use a forward difference, evaluating the derivative at the beginning of the interval. Implicit methods use a backward difference, evaluating the derivative at the end of the interval, a point we have not yet computed. This backward-looking perspective requires solving an equation at each time step rather than simply evaluating a formula, but it provides stability that can make the extra computational cost worthwhile.
See Steve Bruntons excellent video on the topic
The simplest implicit method modifies Euler’s method by evaluating the derivative at \(x_{i+1}\) instead of \(x_i\). Recall that explicit Euler used the forward difference approximation
\[ y'(x_i) \approx \frac{y_{i+1} - y_i}{h} \]
leading to \(y_{i+1} = y_i + h f(x_i, y_i)\). The implicit Euler method instead uses the backward difference
\[ y'(x_{i+1}) \approx \frac{y_{i+1} - y_i}{h} \]
Since \(y'(x_{i+1}) = f(x_{i+1}, y_{i+1})\), this gives the update formula
\[ \boxed{ y_{i+1} = y_i + h f(x_{i+1}, y_{i+1}), \quad i = 0, 1, 2, \ldots } \tag{7.7.8}\]
The crucial difference from explicit Euler is that \(y_{i+1}\) appears on both sides of the equation. We cannot simply compute \(y_{i+1}\) by evaluating the right-hand side. Instead, we must solve an equation. For a general nonlinear function \(f(x, y)\), this requires a root-finding method such as Newton-Raphson or a fixed-point iteration at each time step.
Despite this added complexity, implicit Euler has a major advantage: it is A-stable (also called unconditionally stable), meaning it remains stable for arbitrarily large step sizes on certain problems. This contrasts sharply with explicit Euler, which is conditionally stable: it becomes unstable when \(h\) is too large relative to the problem’s characteristic time scale.
The stability classifications are:
Recall the Euler-Cromer method (semi-implicit Euler) from our pendulum example: it updates velocity first using the current position, then updates position using the new velocity. This semi-implicit approach provides better stability than explicit Euler for oscillatory problems like the pendulum, while being computationally cheaper than fully implicit methods. Euler-Cromer is conditionally stable but with a much larger stability region than explicit Euler.
Just as Heun’s method improved upon explicit Euler by averaging slopes at both endpoints, we can create an implicit version by treating the endpoint symmetrically. The implicit trapezoidal method uses the average of the derivatives at both \(x_i\) and \(x_{i+1}\):
\[ \boxed{ y_{i+1} = y_i + \frac{h}{2}\left( f(x_i, y_i) + f(x_{i+1}, y_{i+1}) \right), \quad i = 0, 1, 2, \ldots } \tag{7.7.9}\]
This formula has an elegant interpretation from numerical integration. If we approximate \(\int_{x_i}^{x_{i+1}} f(x, y(x)) \, dx\) using the trapezoidal rule with the function values at the endpoints, we obtain exactly this update. The method is second-order accurate like Heun’s method but with improved stability properties.
In the context of partial differential equations, particularly for diffusion and heat equations, this method is known as the Crank-Nicolson scheme and is valued for its unconditional stability and second-order accuracy in both space and time.
The implicit midpoint method evaluates the derivative at the temporal midpoint using the average of \(y_i\) and \(y_{i+1}\):
\[ \boxed{ y_{i+1} = y_i + h f\left( \frac{x_i + x_{i+1}}{2}, \frac{y_i + y_{i+1}}{2} \right), \quad i = 0, 1, 2, \ldots } \tag{7.7.10}\]
This method is also second-order accurate and, like implicit Euler, is unconditionally stable. An additional advantage is that the implicit midpoint method tends to preserve energy better than other methods for oscillatory systems like the pendulum or harmonic oscillator. When simulating conservative mechanical systems over long time periods, this energy-preserving property helps maintain physical accuracy where other methods might introduce artificial energy drift.
To understand why implicit methods matter, we examine a stiff ordinary differential equation. Stiffness occurs when a problem involves multiple time scales with vastly different rates of evolution, typically a rapidly decaying transient component combined with a slowly varying solution. Explicit methods must use tiny time steps to remain stable, even when we are only interested in the slow dynamics.
Consider the problem
\[ y'(t) = \lambda (y - \cos t) - \sin t, \quad y(0) = 1 \tag{7.7.11}\]
where \(\lambda\) is a large negative constant. The exact solution is \(y(t) = \cos(t)\), which we can verify by differentiation. The stiffness parameter \(|\lambda|\) controls how quickly perturbations from the exact solution decay. For \(\lambda = -50\), any deviation from \(\cos(t)\) decays with a time constant of \(1/50 \approx 0.02\), while the solution itself varies on a time scale of order \(1\).
import numpy as np
import matplotlib.pyplot as plt
from scipy.optimize import fsolve
import warnings
# Suppress convergence warnings from fsolve (expected for stiff problems)
warnings.filterwarnings('ignore', category=RuntimeWarning, message='.*iteration is not making good progress.*')
# Problem parameters
lam = -50 # Stiffness parameter (large negative)
t0, y0 = 0.0, 1.0
t_end = 2*np.pi
h_stable_explicit = 0.01 # Small step for explicit Euler
h_implicit = 0.2 # Larger step for implicit Euler
# Right-hand side
def f(t, y):
return lam * (y - np.cos(t)) - np.sin(t)
# Exact solution
def y_exact(t):
return np.cos(t)
# Explicit Euler implementation
def explicit_euler(f, t0, y0, t_end, h):
n_steps = int((t_end - t0) / h)
t = np.zeros(n_steps + 1)
y = np.zeros(n_steps + 1)
t[0], y[0] = t0, y0
for i in range(n_steps):
t[i+1] = t[i] + h
y[i+1] = y[i] + h * f(t[i], y[i])
return t, y
# Implicit Euler implementation using root finding
def implicit_euler(f, t0, y0, t_end, h):
n_steps = int((t_end - t0) / h)
t = np.zeros(n_steps + 1)
y = np.zeros(n_steps + 1)
t[0], y[0] = t0, y0
for i in range(n_steps):
t[i+1] = t[i] + h
# Solve y_new = y[i] + h*f(t[i+1], y_new) for y_new
def equation(y_new):
return y_new - y[i] - h * f(t[i+1], y_new)
y[i+1] = fsolve(equation, y[i])[0]
return t, y
# Solve with explicit Euler (small step)
t_exp_small, y_exp_small = explicit_euler(f, t0, y0, t_end, h_stable_explicit)
# Solve with explicit Euler (large step - will be unstable)
h_unstable = 0.05
t_exp_large, y_exp_large = explicit_euler(f, t0, y0, t_end, h_unstable)
# Solve with implicit Euler (large step)
t_imp, y_imp = implicit_euler(f, t0, y0, t_end, h_implicit)
# Exact solution for comparison
t_exact = np.linspace(t0, t_end, 500)
y_exact_vals = y_exact(t_exact)
# Create comparison plot
fig, (ax1, ax2) = plt.subplots(1, 2, figsize=(14, 5))
# Left plot: Explicit Euler with different step sizes
ax1.plot(t_exact, y_exact_vals, 'k-', linewidth=2, label=r'Exact: $y(t) = \cos(t)$')
ax1.plot(t_exp_small, y_exp_small, 'b.-', markersize=3, linewidth=1,
label=f'Explicit Euler, $h = {h_stable_explicit}$ (stable)', alpha=0.7)
ax1.plot(t_exp_large, y_exp_large, 'r.--', markersize=4, linewidth=1,
label=f'Explicit Euler, $h = {h_unstable}$ (unstable)')
ax1.set_xlabel('$t$')
ax1.set_ylabel('$y(t)$')
ax1.set_title('Explicit Euler: Stability Requires Tiny Steps')
ax1.legend()
ax1.grid(True, alpha=0.3)
ax1.set_ylim([-2, 2])
# Right plot: Implicit Euler with large step
ax2.plot(t_exact, y_exact_vals, 'k-', linewidth=2, label=r'Exact: $y(t) = \cos(t)$')
ax2.plot(t_imp, y_imp, 'g.-', markersize=6, linewidth=1.5,
label=f'Implicit Euler, $h = {h_implicit}$ (stable)')
ax2.set_xlabel('$t$')
ax2.set_ylabel('$y(t)$')
ax2.set_title('Implicit Euler: Stable with Large Steps')
ax2.legend()
ax2.grid(True, alpha=0.3)
plt.tight_layout()
plt.show()
# Print error statistics
error_exp_small = np.abs(y_exp_small - y_exact(t_exp_small))
error_imp = np.abs(y_imp - y_exact(t_imp))
print(f"Explicit Euler (h = {h_stable_explicit}): max error = {error_exp_small.max():.6f}")
print(f"Implicit Euler (h = {h_implicit}): max error = {error_imp.max():.6f}")
print(f"\nFor explicit method to be stable, h must be ≲ 2/|λ| = {2/abs(lam):.4f}")
print(f"Implicit method is stable for much larger h = {h_implicit}")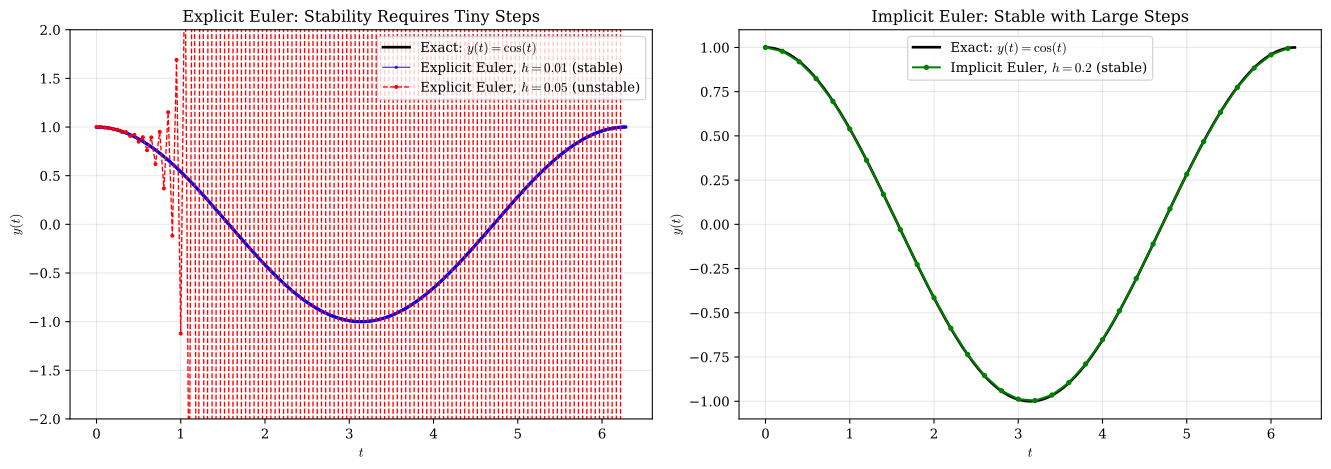
Explicit Euler (h = 0.01): max error = 0.000100
Implicit Euler (h = 0.2): max error = 0.001993
For explicit method to be stable, h must be ≲ 2/|λ| = 0.0400
Implicit method is stable for much larger h = 0.2The comparison reveals the fundamental advantage of implicit methods for stiff problems. The explicit Euler method with \(h = 0.05\) produces wildly oscillating garbage: the method is unstable. To achieve stability, explicit Euler requires \(h \approx 0.01\) or smaller, necessitating hundreds of time steps. In contrast, the implicit Euler method remains stable with \(h = 0.2\), taking only \(\sim 30\) steps while maintaining reasonable accuracy.
The stiffness arises from the term \(\lambda(y - \cos t)\). Any deviation from the exact solution triggers a strong restoring force with time scale \(1/|\lambda|\). Explicit methods must resolve this fast transient, even though it quickly becomes negligible. Implicit methods, by looking backward, can step over the transient without instability.
A differential equation is called stiff when it contains components that evolve on vastly different time scales. Mathematically, stiffness often corresponds to eigenvalues of the Jacobian matrix \(\partial f/\partial y\) with large negative real parts. These eigenvalues force explicit methods to take tiny steps to maintain stability, even when the solution itself varies slowly.
Consider a problem with time scales ranging from \(10^{-6}\) seconds (fast transients) to \(10^{0}\) seconds (slow dynamics). An explicit method must use \(h \sim 10^{-6}\) to remain stable, requiring millions of steps to simulate one second. An implicit method can use \(h \sim 10^{-2}\) or larger, reducing the computational burden by orders of magnitude.
The trade-off is clear: implicit methods require solving (often nonlinear) equations at each step, which costs more per step than explicit methods. However, if the problem is stiff enough to require \(h\) much smaller than the desired accuracy dictates, implicit methods win decisively by taking far fewer steps overall.
Choose explicit methods when the problem is non-stiff, when the right-hand side \(f(x, y)\) is inexpensive to evaluate, and when high-order accuracy is needed, since explicit RK methods readily achieve it. Choose implicit methods when the problem is stiff, when stability matters more than per-step cost, and when long-time simulations require robustness over accuracy. For general-purpose work, use adaptive solvers like scipy.integrate.solve_ivp that automatically select appropriate methods based on problem characteristics.
The scipy.integrate.solve_ivp function provides several implicit methods optimized for stiff problems. The most important is the BDF (Backward Differentiation Formula) family, which generalizes implicit Euler to higher orders.
from scipy.integrate import solve_ivp
# Define the stiff ODE for solve_ivp (uses different signature)
def f_scipy(t, y):
return lam * (y - np.cos(t)) - np.sin(t)
# Solve using BDF (Backward Differentiation Formula) - implicit method
sol_bdf = solve_ivp(f_scipy, [t0, t_end], [y0], method='BDF',
dense_output=True, rtol=1e-6, atol=1e-9)
# Solve using explicit RK45 for comparison
sol_rk45 = solve_ivp(f_scipy, [t0, t_end], [y0], method='RK45',
dense_output=True, rtol=1e-6, atol=1e-9)
# Evaluate on fine grid
t_fine = np.linspace(t0, t_end, 500)
y_bdf = sol_bdf.sol(t_fine)
y_rk45 = sol_rk45.sol(t_fine)
# Plot comparison
fig, (ax1, ax2) = plt.subplots(1, 2, figsize=(14, 5))
ax1.plot(t_fine, y_exact(t_fine), 'k-', linewidth=2, label='Exact')
ax1.plot(t_fine, y_bdf[0], 'g--', linewidth=1.5, label='BDF (implicit)')
ax1.plot(sol_bdf.t, sol_bdf.y[0], 'go', markersize=4, label=f'BDF steps ({len(sol_bdf.t)})')
ax1.set_xlabel('$t$')
ax1.set_ylabel('$y(t)$')
ax1.set_title('BDF Method (Implicit, Stiff-Aware)')
ax1.legend()
ax1.grid(True, alpha=0.3)
ax2.plot(t_fine, y_exact(t_fine), 'k-', linewidth=2, label='Exact')
ax2.plot(t_fine, y_rk45[0], 'b--', linewidth=1.5, label='RK45 (explicit)')
ax2.plot(sol_rk45.t, sol_rk45.y[0], 'bo', markersize=2, label=f'RK45 steps ({len(sol_rk45.t)})')
ax2.set_xlabel('$t$')
ax2.set_ylabel('$y(t)$')
ax2.set_title('RK45 Method (Explicit, Struggles with Stiffness)')
ax2.legend()
ax2.grid(True, alpha=0.3)
plt.tight_layout()
plt.show()
print(f"BDF method: {len(sol_bdf.t)} steps, {sol_bdf.nfev} function evaluations")
print(f"RK45 method: {len(sol_rk45.t)} steps, {sol_rk45.nfev} function evaluations")
print(f"\nBDF is {sol_rk45.nfev/sol_bdf.nfev:.1f}× more efficient for this stiff problem")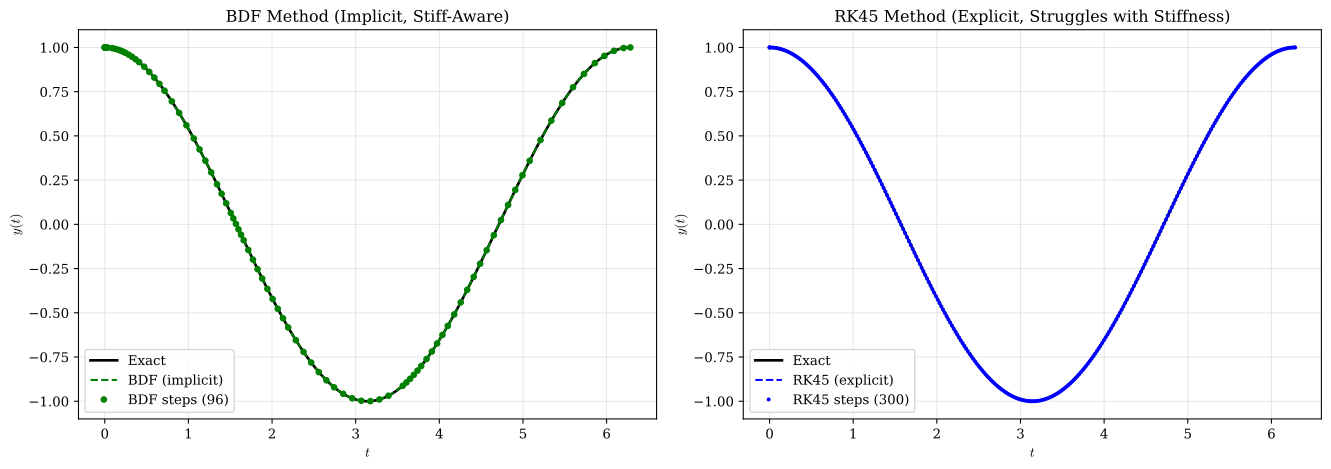
BDF method: 96 steps, 228 function evaluations
RK45 method: 300 steps, 1808 function evaluations
BDF is 7.9× more efficient for this stiff problemThe BDF method recognizes the stiffness and automatically adjusts its strategy, using far fewer steps than the explicit RK45 method. This efficiency becomes even more pronounced for highly stiff systems arising in chemical kinetics, circuit simulation, and structural dynamics with damping.
All numerical methods we have developed (Euler, Heun, midpoint, Runge-Kutta, and implicit methods) are formulated for first-order systems of differential equations of the form
\[ y'(t) = f(t, y), \quad y(t_0) = y_0 \]
Yet most differential equations arising in engineering and physics are higher-order. Newton’s second law \(m \frac{d^2 x}{dt^2} = F\) gives a second-order ODE. The Euler-Lagrange equations of classical mechanics produce coupled second-order systems. Even simple problems like the damped harmonic oscillator or pendulum involve second derivatives.
We now formalize the systematic procedure for converting higher-order differential equations into first-order systems suitable for numerical solution.
Consider a general \(n\)-th order ordinary differential equation
\[ y^{(n)}(t) = f\left(t, y, y', y'', \ldots, y^{(n-1)}\right) \tag{7.7.12}\]
where \(y^{(k)}\) denotes the \(k\)-th derivative. To convert this to a first-order system, we introduce state variables that represent the function and its derivatives:
\[ \begin{align} y_1 &= y \\ y_2 &= y' \\ y_3 &= y'' \\ &\vdots \\ y_n &= y^{(n-1)} \end{align} \]
Differentiating these definitions gives
\[ \begin{align} y_1' &= y' = y_2 \\ y_2' &= y'' = y_3 \\ y_3' &= y''' = y_4 \\ &\vdots \\ y_{n-1}' &= y^{(n-1)} = y_n \\ y_n' &= y^{(n)} = f(t, y_1, y_2, \ldots, y_n) \end{align} \]
This is a first-order system of \(n\) equations for \(n\) unknowns. In vector notation, defining \(\mathbf{y} = [y_1, y_2, \ldots, y_n]^T\), we have
\[ \boxed{ \mathbf{y}' = \mathbf{f}(t, \mathbf{y}) } \tag{7.7.13}\]
where
\[ \mathbf{f}(t, \mathbf{y}) = \begin{bmatrix} y_2 \\ y_3 \\ \vdots \\ y_n \\ f(t, y_1, y_2, \ldots, y_n) \end{bmatrix} \]
Every numerical method we have studied applies directly to this vector system by treating each component separately. Initial conditions must specify all state variables: \(y(t_0) = y_{1,0}\), \(y'(t_0) = y_{2,0}\), etc.
Recall the pendulum example from our earlier discussion of Euler’s method, Section 28.3, where we analyzed the nonlinear second-order ODE
\[ \frac{d^2\theta}{dt^2} + \frac{g}{L}\sin\theta = 0 \tag{7.7.14}\]
with initial conditions \(\theta(0) = \theta_0\) and \(\dot{\theta}(0) = \omega_0\). This is precisely the situation our general procedure addresses: a second-order ODE that must be converted to first-order form.
Following the systematic approach, we introduce state variables
\[ \theta_1 = \theta, \quad \omega = \frac{d\theta}{dt} \]
Differentiating gives
\[ \boxed{ \begin{cases} \dfrac{d\theta}{dt} = \omega \\[0.5em] \dfrac{d\omega}{dt} = -\dfrac{g}{L}\sin\theta \end{cases} } \tag{7.7.15}\]
This is exactly the system we solved earlier when demonstrating Euler’s method for the pendulum! At that time, we converted the equation informally. Now we recognize this as an instance of the general procedure for reducing second-order ODEs to first-order systems. The pattern repeats for all mechanical systems: introduce velocity as a state variable separate from position, then apply Newton’s second law to determine the velocity’s rate of change.
With the pendulum now cast as a first-order system, we can apply SciPy’s solve_ivp to integrate it numerically. This demonstrates the general workflow for solving higher-order ODEs: convert to first-order form, define a function that evaluates the right-hand side, and pass it to the integrator.
solve_ivpWith the first-order system established, we can solve it numerically using SciPy’s solve_ivp. The key step is defining a function that returns the derivatives \([\dot{\theta}, \dot{\omega}]^\mathsf T\) given the current state \([\theta, \omega]^\mathsf T\):
import numpy as np
from scipy.integrate import solve_ivp
import matplotlib.pyplot as plt
# Physical parameters
g = 9.81 # m/s²
L = 1.0 # m
# Define the system: dy/dt = f(t, y) where y = [theta, omega]
def pendulum(t, y):
theta, omega = y
dtheta_dt = omega
domega_dt = -g/L * np.sin(theta)
return [dtheta_dt, domega_dt]
# Initial conditions
theta0 = np.pi/4 # 45 degrees
omega0 = 0.0 # released from rest
y0 = [theta0, omega0]
# Time span
t_span = (0, 10)
t_eval = np.linspace(*t_span, 500)
# Solve
sol = solve_ivp(pendulum, t_span, y0, t_eval=t_eval, method='RK45')# Plot results
fig, (ax1, ax2) = plt.subplots(2, 1, figsize=(8, 5), sharex=True)
ax1.plot(sol.t, np.degrees(sol.y[0]))
ax1.set_ylabel(r'$\theta$ [degrees]')
ax1.grid(True)
ax2.plot(sol.t, sol.y[1])
ax2.set_ylabel(r'$\omega$ [rad/s]')
ax2.set_xlabel('Time [s]')
ax2.grid(True)
plt.tight_layout()
plt.show()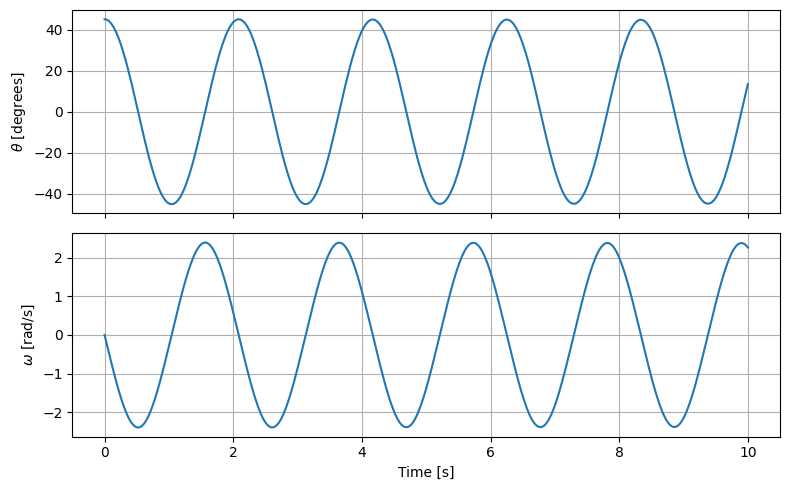
This pattern generalizes to ODEs of any order. We introduce state variables for the function and its derivatives up to order \(n-1\), then express the highest derivative using the original equation. The result is a first-order system that solve_ivp can integrate directly. A third-order ODE yields three first-order equations, a fourth-order yields four, and so on.
For more complex mechanical systems, particularly those with multiple coupled degrees of freedom, the equations of motion take a structured matrix form. Extracting this structure systematically from symbolic expressions enables efficient numerical evaluation and reveals the physical meaning of individual terms.
linear_eq_to_matrixFor systems where the equations are linear in the highest derivatives, we can reformulate the problem as a system of linear equations to be solved:
\[ \mathbf{A} \mathbf{x} = \mathbf{b} \tag{7.7.16}\]
where the matrix \(\mathbf{A}\) and vector \(\mathbf{b}\) can be functions of the system parameters \(q_i\). The size of \(\mathbf{A}\) is \(n \times n\), where \(n\) is the number of degrees of freedom. The main advantage of this formulation is that we can convert both \(\mathbf{A}\) and \(\mathbf{b}\) into numeric functions (Lambda functions of parameters \(q_i\)) which are extremely fast to evaluate. This provides far better computational performance compared to symbolic manipulation at every time step.
SymPy provides the powerful linear_eq_to_matrix function to automatically separate equations into \(\mathbf{A}\) and \(\mathbf{b}\) for the linear system \(\mathbf{A}\mathbf{x} = \mathbf{b}\). For classical mechanics problems, this extraction has a natural interpretation: \(\mathbf{A}\) becomes the mass matrix \(\mathbf{M}\), \(\mathbf{b}\) contains the remaining force terms \(\mathbf{f}\), and the unknown variables \(\mathbf{x}\) are the accelerations \(\ddot{\mathbf{q}}\). Using linear_eq_to_matrix, we extract \(\mathbf{M}\) and \(\mathbf{f}\) from the system
\[ \mathbf{M} \ddot{\mathbf{q}} - \mathbf{f} = \mathbf{0} \tag{7.7.17}\]
We demonstrate this with the pendulum, deriving its equation of motion and extracting the matrix form.
import sympy as sp
from sympy import symbols, sin, cos, Function, Eq, solve
from sympy import Matrix, latex
# Define symbolic variables
t = sp.Symbol('t', real=True, positive=True)
g, L, m = sp.symbols('g L m', real=True, positive=True)
# Generalized coordinate (angle)
theta = Function('theta')(t)
# Angular velocity and acceleration
omega = theta.diff(t)
alpha = omega.diff(t)
equation = Eq(m * L**2 * alpha, -m * g * L * sin(theta))
equation\(\displaystyle L^{2} m \frac{d^{2}}{d t^{2}} \theta{\left(t \right)} = - L g m \sin{\left(\theta{\left(t \right)} \right)}\)
Extract mass matrix M and force vector F
M_sym, F_sym = sp.linear_eq_to_matrix([equation.lhs - equation.rhs], [alpha])M_sym\(\displaystyle \left[\begin{matrix}L^{2} m\end{matrix}\right]\)
F_sym\(\displaystyle \left[\begin{matrix}- L g m \sin{\left(\theta{\left(t \right)} \right)}\end{matrix}\right]\)
M_func = sp.lambdify((theta, g, L, m), M_sym[0], 'numpy')
F_func = sp.lambdify((theta, g, L, m), F_sym[0], 'numpy')
# Evaluate numerically at a specific configuration
theta_val = np.pi/4 # 45 degrees
g_val = 9.81 # m/s^2
L_val = 1.0 # m
m_val = 1.0 # kg
M_numeric = M_func(theta_val, g_val, L_val, m_val)
F_numeric = F_func(theta_val, g_val, L_val, m_val)
# Solve the linear system numerically
# For scalar: just divide, but we use linalg.solve to show the general pattern
alpha_numeric = np.linalg.solve(np.array([[M_numeric]]), np.array([F_numeric]))[0]
alpha_numericnp.float64(-6.936717523440031)This matrix extraction becomes essential for multi-body systems with many degrees of freedom. For a system with \(n\) generalized coordinates \(\mathbf{q} = [q_1, q_2, \ldots, q_n]^T\), the Lagrangian formulation produces \(n\) second-order equations. Using linear_eq_to_matrix with the accelerations \(\ddot{\mathbf{q}} = [\ddot{q}_1, \ddot{q}_2, \ldots, \ddot{q}_n]^T\) extracts the \(n \times n\) mass matrix \(\mathbf{M}\) and the \(n \times 1\) force vector \(\mathbf{F}\).
The conversion to first-order form then follows the pattern
\[ \mathbf{y} = \begin{bmatrix} \mathbf{q} \\ \dot{\mathbf{q}} \end{bmatrix}, \quad \mathbf{y}' = \begin{bmatrix} \dot{\mathbf{q}} \\ \mathbf{M}^{-1}\mathbf{F} \end{bmatrix} \tag{7.7.18}\]
This formulation directly connects to the computational workflow used in multibody dynamics software and finite element analysis of structural dynamics.
See this implementation of a triple pendulum using this approach.
For more information on this topic see Steve Brunton’s video on
Once we have converted a higher-order ODE to a first-order system \(\mathbf{y}' = \mathbf{f}(t, \mathbf{y})\), all our numerical methods apply with minimal modification. The update formulas become vector operations. For explicit Euler, \[ \mathbf{y}_{i+1} = \mathbf{y}_i + h \mathbf{f}(t_i, \mathbf{y}_i) \] For RK4, \[ \begin{align} \mathbf{k}_1 &= h \mathbf{f}(t_i, \mathbf{y}_i) \\ \mathbf{k}_2 &= h \mathbf{f}(t_i + h/2, \mathbf{y}_i + \mathbf{k}_1/2) \\ \mathbf{k}_3 &= h \mathbf{f}(t_i + h/2, \mathbf{y}_i + \mathbf{k}_2/2) \\ \mathbf{k}_4 &= h \mathbf{f}(t_i + h, \mathbf{y}_i + \mathbf{k}_3) \\ \mathbf{y}_{i+1} &= \mathbf{y}_i + \frac{1}{6}(\mathbf{k}_1 + 2\mathbf{k}_2 + 2\mathbf{k}_3 + \mathbf{k}_4) \end{align} \] For implicit Euler, \[ \mathbf{y}_{i+1} = \mathbf{y}_i + h \mathbf{f}(t_{i+1}, \mathbf{y}_{i+1}) \]
The only change from the scalar case is that \(\mathbf{y}\) and \(\mathbf{f}\) are now vectors, and arithmetic operations are performed component-wise. The scipy.integrate.solve_ivp function handles this automatically: you simply pass a vector-valued function and vector initial conditions.
from scipy.integrate import solve_ivp
# Example: Pendulum system y = [theta, omega]
def pendulum_rhs(t, y, g, L):
"""Right-hand side for pendulum: y' = f(t, y)"""
theta, omega = y
return [omega, -(g/L)*np.sin(theta)]
# Parameters
g_val = 9.81 # m/s^2
L_val = 1.0 # m
# Initial conditions: theta(0) = pi/4, omega(0) = 0
y0 = [np.pi/4, 0.0]
# Solve using RK45
t_span = [0, 10]
sol = solve_ivp(pendulum_rhs, t_span, y0, args=(g_val, L_val),
method='RK45', dense_output=True, rtol=1e-8)
print(f"Solution computed from t = {t_span[0]} to t = {t_span[1]}")
print(f"Number of time steps: {len(sol.t)}")
print(f"Function evaluations: {sol.nfev}")Solution computed from t = 0 to t = 10
Number of time steps: 126
Function evaluations: 752The solver treats the pendulum as a system of two equations and applies RK45 component-wise. This same pattern works for systems with dozens or hundreds of state variables, making it applicable to complex multibody systems. Which is what is used here to generate this triple pendulum simulation:
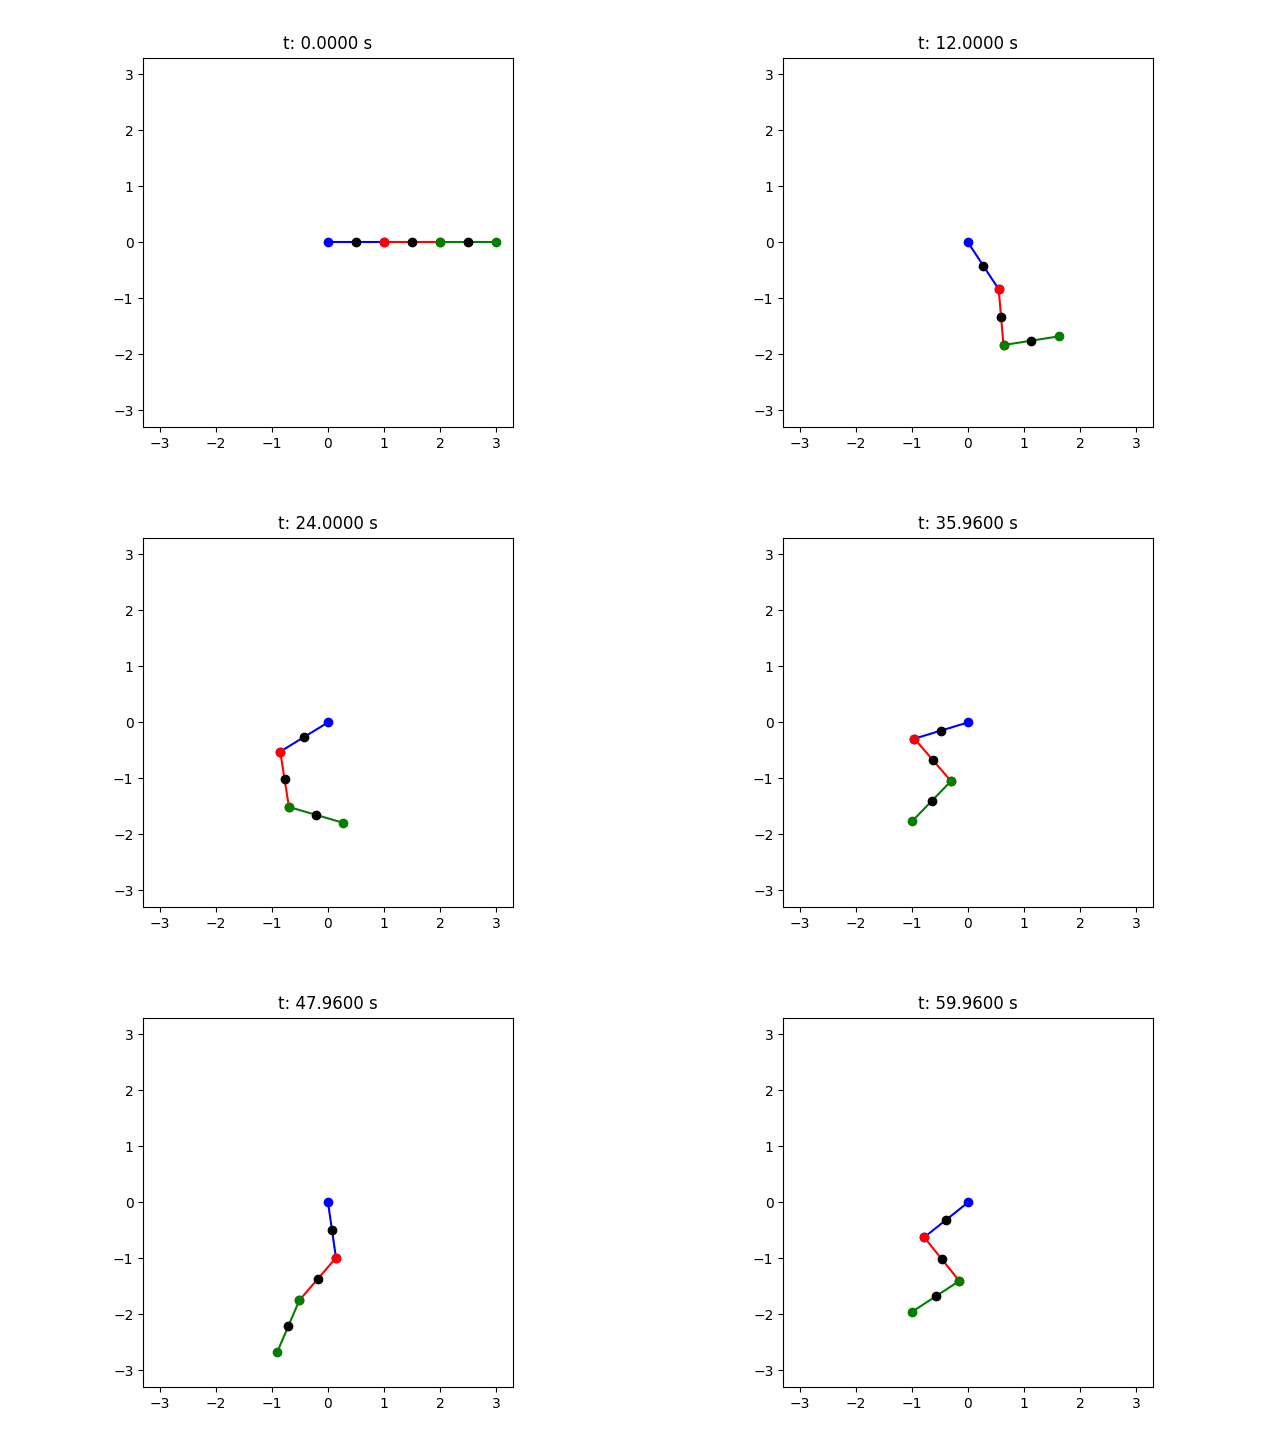
We conclude with a complete example showing the power of the first-order system formulation: the damped harmonic oscillator, whose second-order equation
\[ m\ddot{x} + c\dot{x} + kx = 0 \tag{7.7.19}\]
models everything from vibrating springs to RLC circuits to suspension systems. The parameters are mass \(m\), damping coefficient \(c\), and spring stiffness \(k\).
Introducing state variables \(x_1 = x\) (position) and \(x_2 = \dot{x}\) (velocity), we obtain
\[ \boxed{ \begin{cases} \dot{x}_1 = x_2 \\[0.5em] \dot{x}_2 = -\dfrac{c}{m}x_2 - \dfrac{k}{m}x_1 \end{cases} } \tag{7.7.20}\]
In matrix form: \(\mathbf{M}\ddot{\mathbf{x}} = \mathbf{F}\) where \(\mathbf{M} = m\) and \(\mathbf{F} = -c\dot{x} - kx\).
from scipy.integrate import solve_ivp
import numpy as np
import matplotlib.pyplot as plt
# System parameters
m = 1.0 # mass (kg)
k = 10.0 # spring stiffness (N/m)
c_values = [0.0, 1.0, 3.0, 7.0] # Different damping coefficients
# Natural frequency
omega_n = np.sqrt(k/m)
print(f"Natural frequency ω_n = {omega_n:.3f} rad/s")
print(f"Period T = {2*np.pi/omega_n:.3f} s")
print()
# Define the system
def damped_oscillator(t, y, m, c, k):
"""y = [x, v] where x is position, v is velocity"""
x, v = y
dxdt = v
dvdt = -(c/m)*v - (k/m)*x
return [dxdt, dvdt]
# Initial conditions
x0 = 1.0 # initial displacement (m)
v0 = 0.0 # initial velocity (m/s)
y0 = [x0, v0]
# Time span
t_span = [0, 10]
t_eval = np.linspace(t_span[0], t_span[1], 1000)
# Solve for different damping values
solutions = []
for c in c_values:
sol = solve_ivp(damped_oscillator, t_span, y0, args=(m, c, k),
t_eval=t_eval, method='RK45', rtol=1e-10)
solutions.append(sol)
zeta = c / (2 * np.sqrt(k*m)) # damping ratio
print(f"c = {c:.1f}: ζ = {zeta:.3f} ({'undamped' if zeta==0 else 'underdamped' if zeta<1 else 'critically damped' if zeta==1 else 'overdamped'})")
# Create visualization: time series and phase portraits
fig = plt.figure(figsize=(12, 10))
gs = fig.add_gridspec(2, 1, hspace=0.4) # Changed to 2 rows, 1 column
# 1. Time series plot (Top)
ax_time = fig.add_subplot(gs[0, 0])
for i, (sol, c) in enumerate(zip(solutions, c_values)):
zeta = c / (2 * np.sqrt(k*m))
label = f'c = {c:.1f} (ζ = {zeta:.2f})'
ax_time.plot(sol.t, sol.y[0], linewidth=2, label=label)
ax_time.set_xlabel('Time $t$ (s)', fontsize=12)
ax_time.set_ylabel('Position $x(t)$ (m)', fontsize=12)
ax_time.set_title('Damped Harmonic Oscillator: Time Evolution', fontsize=14, fontweight='bold')
ax_time.legend(loc='upper right', fontsize=10)
ax_time.grid(True, alpha=0.3)
# 2. Phase portrait (Bottom)
ax_phase_combined = fig.add_subplot(gs[1, 0])
for i, (sol, c) in enumerate(zip(solutions, c_values)):
ax_phase_combined.plot(sol.y[0], sol.y[1], linewidth=2)
# Mark starting point
ax_phase_combined.plot(sol.y[0][0], sol.y[1][0], 'o', markersize=8, color=f'C{i}')
ax_phase_combined.set_xlabel('Position $x$ (m)', fontsize=12)
ax_phase_combined.set_ylabel('Velocity $v$ (m/s)', fontsize=12)
ax_phase_combined.set_title('Phase Portrait: All Damping Cases', fontsize=14, fontweight='bold')
ax_phase_combined.grid(True, alpha=0.3)
ax_phase_combined.axhline(0, color='k', linewidth=0.5)
ax_phase_combined.axvline(0, color='k', linewidth=0.5)
# This prevents the overlapping labels/ticks
plt.show()
# Energy analysis
print("\nEnergy behavior:")
for i, (sol, c) in enumerate(zip(solutions, c_values)):
# Total energy E = (1/2)*m*v^2 + (1/2)*k*x^2
E = 0.5*m*sol.y[1]**2 + 0.5*k*sol.y[0]**2
E0 = E[0]
E_final = E[-1]
print(f" c = {c:.1f}: E(0) = {E0:.4f} J, E(final) = {E_final:.6f} J, "
f"dissipated: {100*(1-E_final/E0):.2f}%")Natural frequency ω_n = 3.162 rad/s
Period T = 1.987 s
c = 0.0: ζ = 0.000 (undamped)
c = 1.0: ζ = 0.158 (underdamped)
c = 3.0: ζ = 0.474 (underdamped)
c = 7.0: ζ = 1.107 (overdamped)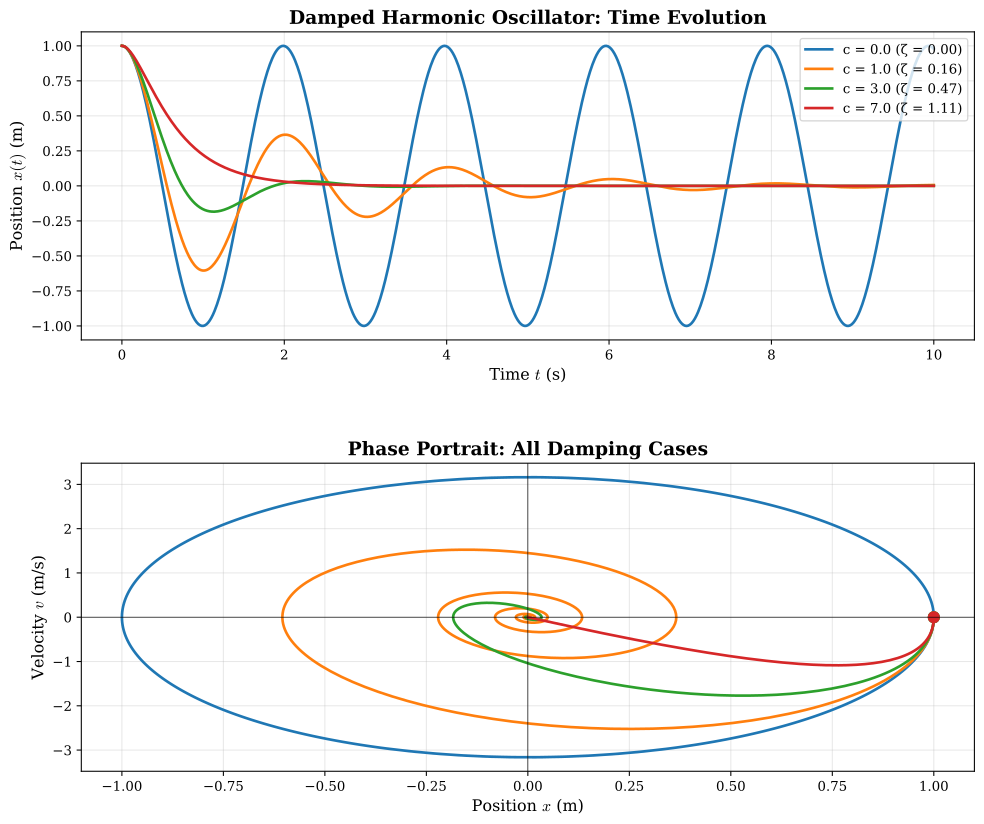
Energy behavior:
c = 0.0: E(0) = 5.0000 J, E(final) = 4.999955 J, dissipated: 0.00%
c = 1.0: E(0) = 5.0000 J, E(final) = 0.000214 J, dissipated: 100.00%
c = 3.0: E(0) = 5.0000 J, E(final) = 0.000000 J, dissipated: 100.00%
c = 7.0: E(0) = 5.0000 J, E(final) = 0.000000 J, dissipated: 100.00%The phase portrait (the trajectory in \((x, v)\) space) provides geometric insight into the system’s behavior. For the undamped case (\(c = 0\)), the trajectory is a closed ellipse representing periodic motion. As damping increases, trajectories spiral inward toward the origin (equilibrium). The critically damped case returns to equilibrium fastest without oscillation, while overdamped systems return slowly.
This visualization technique applies broadly to any dynamical system. The phase portrait reveals stability, limit cycles, bifurcations, and chaotic behavior that would be obscure in time-series plots alone. Modern dynamical systems theory is built on this geometric perspective, made accessible through numerical integration of first-order systems.
The transformation from higher-order scalar ODEs to first-order vector systems is more than notational convenience. It reveals that all numerical methods (Euler, Runge-Kutta, implicit methods) apply uniformly to systems regardless of origin. Whether solving Newton’s equations, analyzing electrical circuits, or modeling chemical reactions, the computational pattern remains identical once we express problems in first-order form.
This unification also connects to modern theory: differential geometry views dynamical systems as vector fields on manifolds, optimal control treats trajectories in state space, and geometric integrators preserve structure (symplecticity, energy, momentum) through careful discretization. Our simple conversion procedure opens the door to these sophisticated perspectives.